Fig. 3.
Download original image
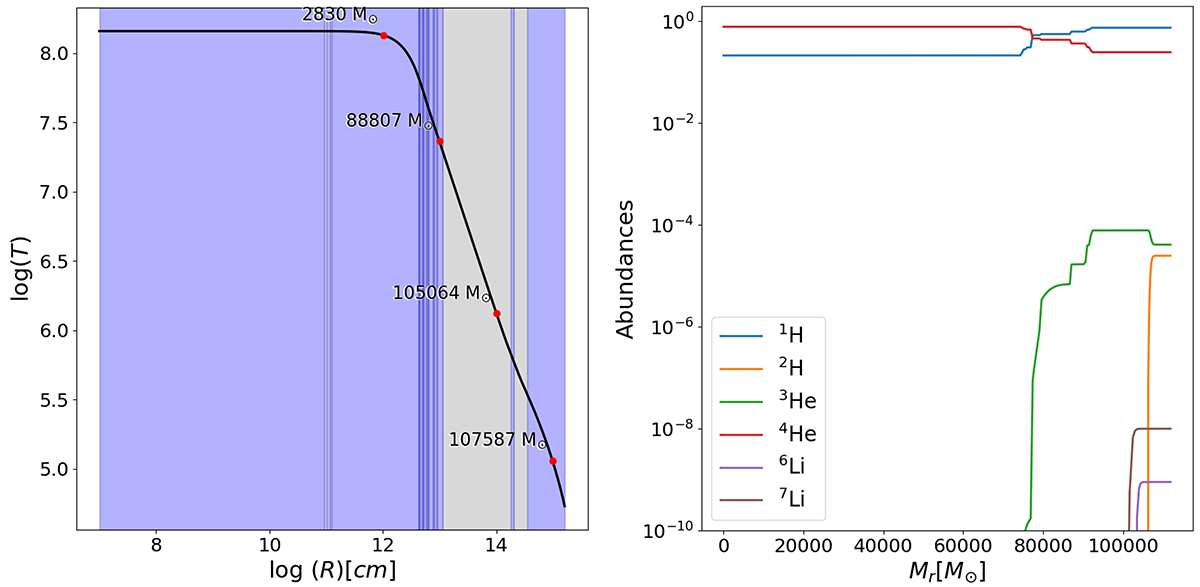
The distribution of physical parameters and abundances of a 0.1 M⊙/yr model just before the end of evolution. Left panel: Log T versus log R plot for the 0.1 M⊙/yr model at the end of its evolution upon encountering GR instability at a mass of 108 000 M⊙. The blue zones indicate convective zones and grey zones correspond to radiative zones. The enclosed mass is indicated at different radii (see the numbers at red points). Most of the mass (105 000 M⊙) is within a radius of 1013 cm or 14.0 R⊙ that represents 1% of the total radius. Only a fraction of mass (still 23 000 M⊙) in the outer envelope implying the star is extremely bloated. Right panel: The plot depicts the change in abundance of various elements inside the 0.1 M⊙/yr model upon encountering the GR instability when central mass fraction of hydrogen is 0.244.
Current usage metrics show cumulative count of Article Views (full-text article views including HTML views, PDF and ePub downloads, according to the available data) and Abstracts Views on Vision4Press platform.
Data correspond to usage on the plateform after 2015. The current usage metrics is available 48-96 hours after online publication and is updated daily on week days.
Initial download of the metrics may take a while.