Fig. 1.
Download original image
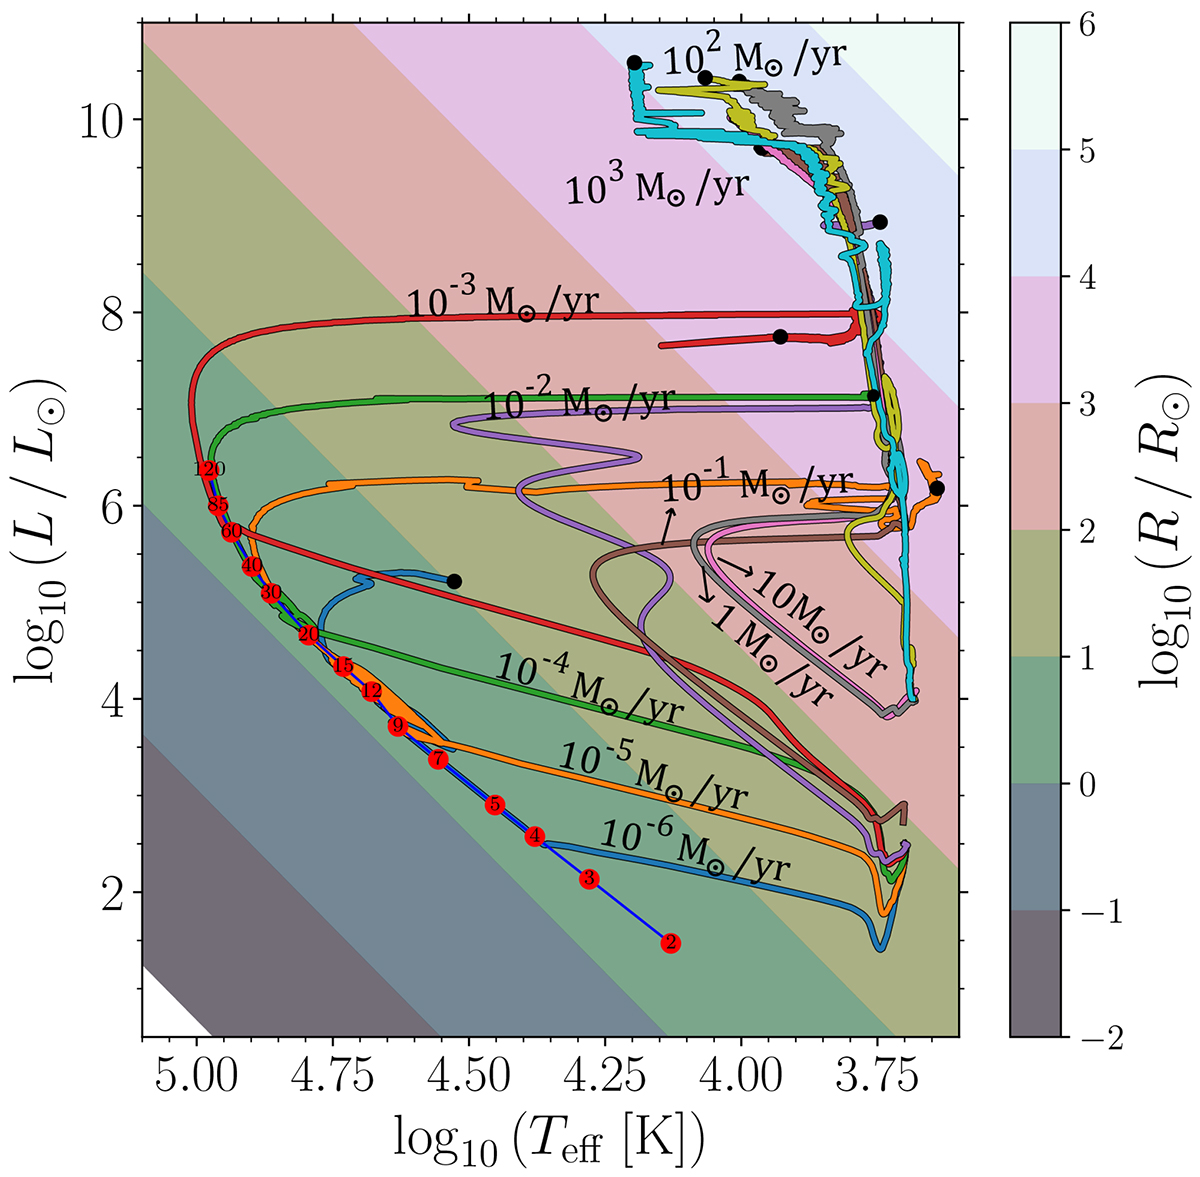
HR diagram of massive and supermassive stars at zero metallicity at accretion rates of 10−6 M⊙ yr−1 to 103 M⊙ yr−1. The background colors indicate radii in units of solar radius. The blue line represents the Z = 0 ZAMS track with red dots marking masses in solar units. The tracks are labelled by accretion rate in black. The black dots indicate the end point of computation which corresponds to end of core Silicon burning for accretion rates up to 10−2 M⊙ yr−1 and the onset of GR instability for higher accretion rates.
Current usage metrics show cumulative count of Article Views (full-text article views including HTML views, PDF and ePub downloads, according to the available data) and Abstracts Views on Vision4Press platform.
Data correspond to usage on the plateform after 2015. The current usage metrics is available 48-96 hours after online publication and is updated daily on week days.
Initial download of the metrics may take a while.