Fig. 5.
Download original image
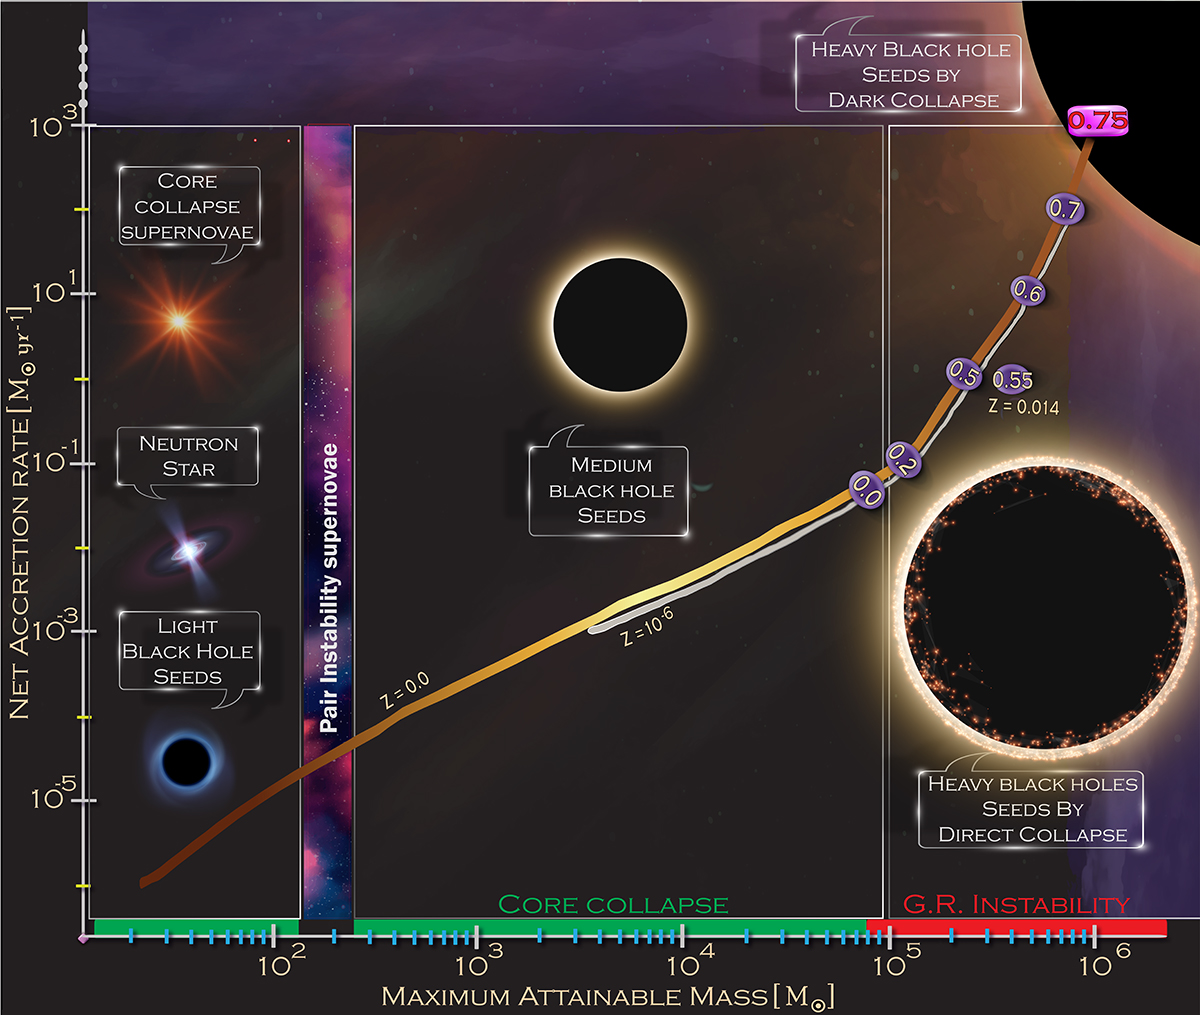
Final mass versus accretion rate for 10−6 M⊙ yr−1 to 103 M⊙ yr−1. The gold line is for zero metallicity models, the silver line is for Z = 10−6 Z⊙ and the single dot at 1 M⊙ yr−1 is the solar metallicity model. The green bar marks the final mass range for which collapse occurs after core Si burning and the red bar is the mass range for which the GRI triggers collapse during central H burning. The vertical pair instability strip spans 150–250 M⊙ and is for the non accreting models while 7–150 M⊙ progenitors produce neutron stars or stellar-mass BHs. The oval shapes with numbers correspond to the central mass fraction of hydrogen at the time GRI is triggered.
Current usage metrics show cumulative count of Article Views (full-text article views including HTML views, PDF and ePub downloads, according to the available data) and Abstracts Views on Vision4Press platform.
Data correspond to usage on the plateform after 2015. The current usage metrics is available 48-96 hours after online publication and is updated daily on week days.
Initial download of the metrics may take a while.