Fig. 4.
Download original image
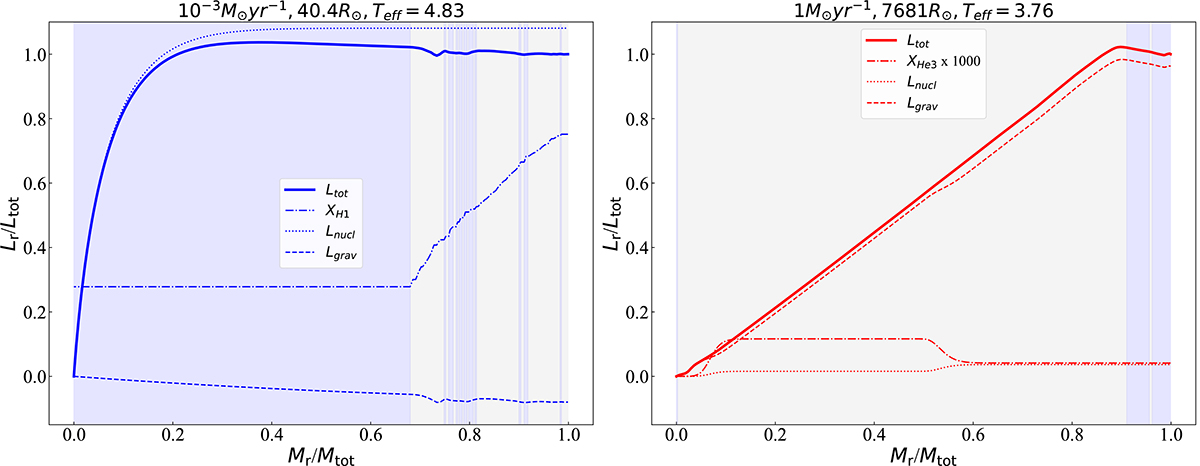
Variation of luminosity (in mass fraction) as a function of mass coordinate inside two accreting models compared at same total luminosity. Left: total (solid), nuclear (dotted) and gravitational (dashed) luminosities versus enclosed mass fraction for the 10−3 M⊙ yr−1 star at a mass of 2072 M⊙ and total luminosity of 6.9 × 10⁷ L⊙. Right: Same as on the left but for a pre-MS 1.0 M⊙ yr−1 star at a mass of 2337 M⊙ and same total luminosity (in this case powered only by gravitational contraction). The dot-dashed lines show mass fractions for H (left) and 3He (right) in the star. The shaded blue and grey zones depict the convective and radiative regions respectively.
Current usage metrics show cumulative count of Article Views (full-text article views including HTML views, PDF and ePub downloads, according to the available data) and Abstracts Views on Vision4Press platform.
Data correspond to usage on the plateform after 2015. The current usage metrics is available 48-96 hours after online publication and is updated daily on week days.
Initial download of the metrics may take a while.