Open Access
Fig. 2.
Download original image
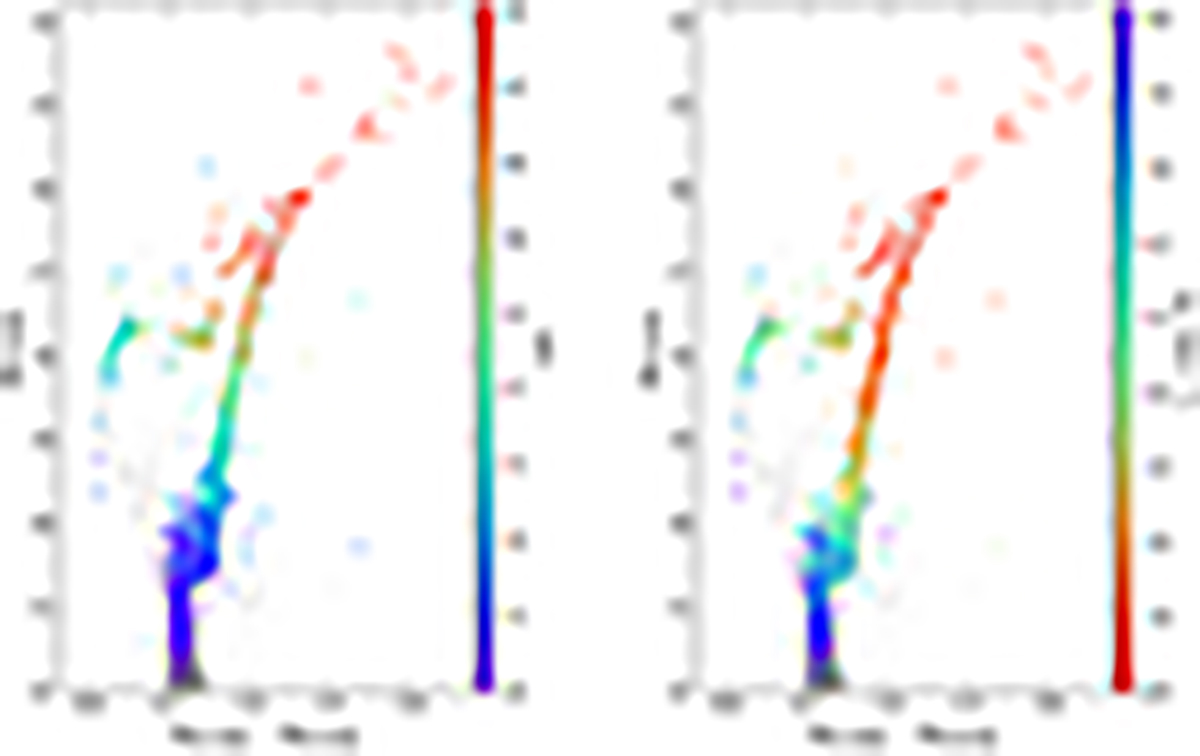
CMD of M75 (gray dots) obtained from the HST/WFC3 photometric catalog described in Sect. 3. The large colored circles show the spectroscopic targets of the MUSE catalog (see Sect. 3.3), while the color scale in the left and right panels represents the S/N of the spectra and the RV uncertainty, respectively.
Current usage metrics show cumulative count of Article Views (full-text article views including HTML views, PDF and ePub downloads, according to the available data) and Abstracts Views on Vision4Press platform.
Data correspond to usage on the plateform after 2015. The current usage metrics is available 48-96 hours after online publication and is updated daily on week days.
Initial download of the metrics may take a while.