| Issue |
A&A
Volume 688, August 2024
|
|
|---|---|---|
| Article Number | A156 | |
| Number of page(s) | 9 | |
| Section | Cosmology (including clusters of galaxies) | |
| DOI | https://doi.org/10.1051/0004-6361/202449883 | |
| Published online | 14 August 2024 | |
Late-time constraints on interacting dark energy: Analysis independent of H0, rd, and MB
1
Frankfurt Institute for Advanced Studies (FIAS), Ruth-Moufang-Strasse 1, 60438 Frankfurt am Main, Germany
e-mail: This email address is being protected from spambots. You need JavaScript enabled to view it.
2
Helsinki Institute of Physics, University of Helsinki, PO Box 64 00014 Helsinki, Finland
3
Department of Mathematics, Presidency University, 86/1 College Street, Kolkata 700073, India
4
Institute of Systems Science, Durban University of Technology, PO Box 1334 Durban 4000, Republic of South Africa
5
Institute for Nuclear Research and Nuclear Energy, Bulgarian Academy of Sciences, Sofia, Bulgaria
6
School of Mathematics and Statistics, University of Sheffield, Hounsfield Road, Sheffield S3 7RH, UK
7
Instituto de Física, Universidade Federal do Rio Grande do Sul, 91501-970 Porto Alegre, RS, Brazil
8
Divisão de Astrofísica, Instituto Nacional de Pesquisas Espaciais, Avenida dos Astronautas 1758, São José dos Campos, 12227-010 São Paulo, Brazil
Received:
6
March
2024
Accepted:
27
May
2024
Abstract
We investigated a possible interaction between cold dark matter and dark energy, corresponding to a well-known interacting dark energy model discussed in the literature within the context of resolving the Hubble tension. We put constraints on it in a novel way, by creating new likelihoods with an analytical marginalization over the Hubble parameter H0, the sound horizon rd, and the supernova absolute magnitude MB. Our aim is to investigate the impacts on the coupling parameter of the interacting model, ξ, and the equation of state of dark energy w and the matter density parameter Ωm, 0. The late-time cosmological probes used in our analysis include the PantheonPlus (calibrated and uncalibrated), cosmic chronometers, and baryon acoustic oscillation samples and the Pantheon for comparison. Through various combinations of these datasets, we demonstrate hints of an up to 2σ deviation from the standard Λ cold dark matter model.
Key words: cosmological parameters / cosmology: observations / dark energy
© The Authors 2024
 Open Access article, published by EDP Sciences, under the terms of the Creative Commons Attribution License (https://creativecommons.org/licenses/by/4.0), which permits unrestricted use, distribution, and reproduction in any medium, provided the original work is properly cited.
This article is published in open access under the Subscribe to Open model. This email address is being protected from spambots. You need JavaScript enabled to view it. to support open access publication.
1. Introduction
Over the last few decades, cosmological measurements indicating an acceleration in the expansion of the Universe have suggested that Einstein’s general theory of relativity (GR) alone is probably not the ultimate theory of gravity capable of explaining all the available observational evidence. Observational data from Type Ia supernovae (SNeIa; Riess et al. 1998; Perlmutter et al. 1999; Scolnic et al. 2018), baryon acoustic oscillations (BAOs; Addison et al. 2013; Aubourg et al. 2015; Cuesta et al. 2015; Cuceu et al. 2019), and the cosmic microwave background (CMB; Planck Collaboration VI 2020) provide compelling evidence for modifications either in the matter sector of the Universe or in the gravitational sector. The simplest modification is the introduction of a positive cosmological constant, Λ, into the gravitational equations described by Einstein’s GR Riess et al. (1998), Perlmutter et al. (1999), Weinberg (1989), Lombriser (2019), Copeland et al. (2006), Frieman et al. (2008) and the resulting picture – the so-called Λ cold dark matter (ΛCDM) cosmological model – has been found to be consistent with a wide range of observational datasets. Nevertheless, the ΛCDM model is now facing both theoretical and observational challenges (Verde et al. 2019; Riess 2019; Di Valentino et al. 2021a,b,c; Riess et al. 2022). Consequently, there is growing demand for a revision of ΛCDM cosmology (Knox & Millea 2020; Jedamzik et al. 2021; Di Valentino et al. 2021d; Abdalla et al. 2022; Kamionkowski & Riess 2023; Escudero et al. 2022; Vagnozzi 2023; Khalife et al. 2024). Thus, the question arises as to whether GR + Λ is the fundamental theory of gravity, or merely an approximation of a more complete gravitational theory yet to be discovered. One natural avenue of exploration is to consider modified gravity theories, which show theoretical and observational promise in addressing the observed discrepancies. With the ever-increasing sensitivity and precision of present and upcoming astronomical surveys, modified gravity theories emerge as viable contenders alongside GR + Λ. The search for the ultimate answer in this direction is ongoing. According to the existing literature, we currently have a cluster of cosmological scenarios broadly classified into two categories: (i) cosmological scenarios within GR, commonly known as dark energy models, and (ii) cosmological scenarios beyond GR, commonly known as modified gravity models.
In this article, we focus on the first approach, which means that the gravitational sector of the Universe is well described by GR, but modifications of the matter fields are needed to explain the current accelerating phase and recent observational tensions and anomalies that persist in the structure of the standard cosmological model. The list of cosmological models in this particular domain is extensive, and here we are interested in investigating one of the generalized and more appealing cosmological theories in which dark matter (DM) and dark energy (DE) interact with each other via an energy exchange mechanism between them. The theory of interacting DM–DE, widely known as IDE, has garnered significant attention in the community and has been extensively studied, with many promising results Amendola (2000), Cai & Wang (2005), Barrow & Clifton (2006), Valiviita et al. (2008, 2010), Gavela et al. (2010), Chen et al. (2014), Clemson et al. (2012), Salvatelli et al. (2013, 2014), Li & Zhang (2014), Yang & Xu (2014a,b,c), Faraoni et al. (2014), Li et al. (2014), Pan et al. (2015, 2018, 2019, 2020a), Nunes et al. (2016), Yang et al. (2016, 2017, 2018a,b,c, 2019a,b), Di Valentino et al. (2017, 2020a,b, 2021e), Mifsud & Van De Bruck (2017), Johnson & Shankaranarayanan (2021), Johnson et al. (2022), Gao et al. (2021), Escamilla et al. (2023), Zhai et al. (2023), Hoerning et al. (2023), Pan & Yang (2023), Silva et al. (2024), Giarè et al. (2024) (also see Bolotin et al. 2014, Wang et al. 2016, 2024). The IDE models gained prominence in modern cosmology due to their capacity to alleviate tensions in some key cosmological parameters (see Di Valentino et al. 2017, 2020a; Yang et al. 2018d; Aloni et al. 2022; Khachatryan & Stepanian 2020; Liu et al. 2022; Wagner 2022; Zhao et al. 2023; Vagnozzi 2023; Pan & Yang 2023; Wang et al. 2024 for those alleviating the Hubble constant tension, and see Pourtsidou & Tram 2016; An et al. 2018; Benisty 2021; Nunes & Vagnozzi 2021; Lucca 2021; Joseph et al. 2023; Naidoo et al. 2024 for those alleviating the growth tension). In IDE, the coupling function (also known as the interaction function) characterizing the transfer of energy between the dark components is the only ingredient that plays an effective role, and its non-null value indicates a deviation from the ΛCDM cosmology. The coupling between the dark sectors therefore invites new physics beyond the ΛCDM paradigm and could offer interesting possibilities in cosmology.
In IDE, the choice of the coupling function is not unique, and there is freedom to explore a variety of interaction functions with the available observational data. In the current work, we investigate a particular well-known interacting model Wang et al. (2016), Di Valentino et al. (2017, 2020a), Yang et al. (2020) using the latest available data from SNeIa, transversal BAO measurements, and the cosmic chronometers (CCs). We adopt a model-independent approach to address the cosmological tensions. Instead of assuming any prior knowledge about specific model parameters related to these tensions in cosmology, we choose to marginalize over these parameters. This means, we integrate out these parameters from the resulting χ2, ensuring that our results become independent of them.
The marginalization approach, which stems from previous works Di Pietro & Claeskens (2003), Nesseris & Perivolaropoulos (2004), Perivolaropoulos (2005), Lazkoz et al. (2005), Basilakos & Nesseris (2016), Anagnostopoulos & Basilakos (2018), Camarena & Marra (2021), was recently used by Staicova & Benisty (2022) to study DE models by marginalizing over H0 ⋅ rd. Staicova & Benisty (2022) demonstrated that the preference for a DE model can be highly sensitive to the choice of the BAO dataset when using the marginalization approach. For this reason, we adopt the same methodology here but in the context of an interaction scenario between DM and DE. Our goal is to clarify the robustness of previous results when the tension parameter is marginalized and to assess the sensitivity to the choice of the SNeIa dataset
The paper is organized as follows. In Sect. 2, we describe the gravitational equations of an IDE scenario and then we propose two different IDE models distinguished by the equation of state of the DE sector that we study in this work. In Sect. 3, we describe the methodology and the observational datasets used to constrain these interacting cosmological scenarios. Then, in Sect. 4, we present the results of the interacting scenarios proposed in this work. Finally, in Sect. 5, we present our main conclusions.
2. Interacting dark matter and dark energy
We work under the assumption of a spatially flat Friedmann-Lemaître-Robertson-Walker (FLRW) line element:
![Mathematical equation: $$ \begin{aligned} \mathrm{d}s^2 = -\mathrm{d}t^2 + a^2(t) \left[\mathrm{d}r^2 + r^2 (\mathrm{d}\theta ^2 + \sin ^2 \theta \mathrm{d}\phi ^2)\right], \end{aligned} $$](/articles/aa/full_html/2024/08/aa49883-24/aa49883-24-eq1.gif) (1)
(1)
where a(t) is the scale factor of the Universe. We consider that the matter sector of the Universe is minimally coupled to gravity as described by Einstein’s GR and the matter sector is comprised of nonrelativistic baryons and two perfect dark fluids, namely pressureless DM and DE. In the presence of a nongravitational interaction between DM and DE, which is characterized by a coupling function Q(t), also known as the interaction rate, the continuity equations of the dark fluids can be written as Wang et al. (2016):
 (2)
(2)
where an overhead dot represents the derivative with respect to the cosmic time; ρCDM, ρDE are the energy density for pressureless DM and DE, respectively; w represents the barotropic equation of state for the DE fluid; and H is the Hubble parameter. The Hubble parameter connects the energy densities of the matter sector as
 (3)
(3)
where G is Newton’s gravitational constant and ρb denotes the energy density of baryons, and it follows the usual evolution law ρb ∝ (a/a0)−3, in which a0 is the scale factor at the present time, set to unity. As we are only interested in the background dynamics at late times, we neglect the radiation contribution. Finally, Q(t) in Eq. (2) denotes the interaction function indicating the rate of energy transfer between the dark components. We note that Q(t) > 0 indicates the transfer of energy from DM to DE and Q(t) < 0 indicates that energy flow takes place from DE to DM. Once the interaction function is prescribed, the background dynamics of the model can be determined using the conservation equations (2), together with the Friedmann equation (3). In this article, we focus on the spatially flat case.
Now, there are precisely two approaches to selecting an interaction function. One can either derive this interaction function from some fundamental physical theory, or, alternatively, consider a phenomenological choice of the interaction function and test it using observational data. Although the former approach is theoretically robust and appealing, the quest for a definitive solution in this regard is still ongoing. We consider a well-known interaction function of the form Wang et al. (2016):
 (4)
(4)
which was initially motivated on phenomenological grounds, but is not robustly backed up theoretically Pan et al. (2020a). In the expression for Q in Eq. (4), ξ refers to the coupling parameter of the interaction function and in general this could be either constant or time dependent Chen et al. (2014), Faraoni et al. (2014), Yang et al. (2019c). Although the time-varying ξ is expected to offer a more generalized interacting dynamics, in this work we consider that ξ is constant. We note that for some coupling functions, the energy density of one or both of the dark fluids could be negative Pan et al. (2020b). However, we do not impose any further constraints on the proposed model and allow the observational data to decide the fate of the resulting cosmological scenario. As at present the community is expressing an interest in the negativity of the energy density of the DE or the cosmological constant Poulin et al. (2018), Wang et al. (2018), Visinelli et al. (2019), Calderón et al. (2021), we keep this issue open for the future.
In this work, we explore two distinct IDE scenarios: (i) the IDE scenario where the EoS of DE takes the simplest value of w = −1, denoted as the “ξCDM” model and (ii) the IDE scenario where w ≠ −1 is constant but is a parameter that is free to vary in a certain region, referred to as the “wξCDM” model.
Given the coupling function (4), and assuming our general case with the DE equation of state, w, the evolution laws of DE and CDM can be analytically obtained as
 (5)
(5)
Consequently, the dimensionless Hubble parameter can be expressed as
 (6)
(6)
where 1 + z = a0/a, and Ωi = ρi/ρc (i = CDM, DE) is the density parameter of the ith fluid (consequently, Ωi, 0 represents the current value of the same parameter), where ρc = 3H2/8πG is the critical density of the Universe. We note that Ωm, 0 = ΩCDM, 0 + Ωb, 0. From the initial condition E(0) = 1, we get Ωm, 0 + ΩDE, 0 = 1.
3. Methodology
In this section, we describe the marginalization procedure that has been adopted in this article in an attempt to constrain the proposed cosmological interaction scenarios.
3.1. Marginalization over degenerate parameters
To circumvent the Hubble tension and mitigate the degeneracy between H0 and rd in BAO data, we redefine the χ2 to integrate variables we prefer not to directly handle. In a cosmological model with n free parameters (e.g., Ωm, 0, ξ, w, etc.), these parameters are constrained by minimizing the χ2 function:
![Mathematical equation: $$ \begin{aligned} \chi ^2 = \sum _{i} \left[{\boldsymbol{v}}_{\rm obs} - {\boldsymbol{v}}_{\rm model}\right]^{T} C_{ij}^{-1} \left[{\boldsymbol{v}}_{\rm obs} - {\boldsymbol{v}}_{\rm model}\right], \end{aligned} $$](/articles/aa/full_html/2024/08/aa49883-24/aa49883-24-eq7.gif) (7)
(7)
where vobs represents the vector of observed points at each z, vmodel denotes the theoretical prediction of the model, and Cij is the covariance matrix. For uncorrelated data, Cij reduces to a diagonal matrix with the errors ( ) on the diagonal.
In our analysis, we use three distinct datasets: the SNeIa datasets (Pantheon, calibrated, and uncalibrated PantheonPlus), the transverse BAO dataset, and the CC dataset. Below, we delineate the marginalization process for each of these datasets.
3.2. BAO redefinition
For the BAO dataset, we use the angular scale measurement θBAO(z), which provides the angular diameter distance DA at redshift z:
 (8)
(8)
where
 (9)
(9)
and
 (10)
(10)
This is valid for the flat universe case. We can express the vector as a dimensionless function multiplied by the parameter c/H0rd:
 (11)
(11)
By following the approach in Lazkoz et al. (2005), Basilakos & Nesseris (2016), Anagnostopoulos & Basilakos (2018), Camarena & Marra (2021), Staicova & Benisty (2022), one can isolate  in the χ2 expression by expressing it as
 (12)
(12)
where  and
and
 (13a)
(13a)
 (13b)
(13b)
 (13c)
(13c)
Using Bayes’s theorem and marginalizing over β = H0rd/c, we obtain
![Mathematical equation: $$ \begin{aligned} p(D,M) = \frac{1}{p(D|M)} \int \exp \left[-\frac{1}{2}\chi ^{2}\right] \mathrm{d}\beta , \end{aligned} $$](/articles/aa/full_html/2024/08/aa49883-24/aa49883-24-eq19.gif) (14)
(14)
where D represents the data used and M denotes the model. Consequently, by employing  , we derive the marginalized χ2 in the form:
 (15)
(15)
This  depends solely on h(z), with no dependence on H0 ⋅ rd/c.
3.3. Supernova redefinition
Similarly, by following the approach used in Di Pietro & Claeskens (2003), Nesseris & Perivolaropoulos (2004), Perivolaropoulos (2005), Lazkoz et al. (2005), Benisty (2023), we integrate over MB and H0 to derive the integrated χ2. The measurements of SNeIa are described by the luminosity distance dL(z) (related to DA by DA = dL(z)/(1 + z)2) and its distance modulus μ(z), which is given by
![Mathematical equation: $$ \begin{aligned} \mu _B (z) - M_B = 5 \log _{10} [d_{\rm L}(z)] + 25, \end{aligned} $$](/articles/aa/full_html/2024/08/aa49883-24/aa49883-24-eq23.gif) (16)
(16)
where dL is measured in megaparsecs (Mpc), and MB represents the absolute magnitude.
For these, one can obtain the following integrated  :
:
 (17)
(17)
where
 (18a)
(18a)
 (18b)
(18b)
 (18c)
(18c)
where Δμ = μi − 5log10[dL(zi)], E represents the unit matrix, and  is the inverse covariance matrix of the dataset. For the Pantheon dataset, the total covariance matrix is given by Ccov = Dstat + Csys, where
  arises from the measurement and Csys is provided separately Deng & Wei (2018). For PantheonPlus, the covariance matrix already includes both the statistical and systematic errors.
3.4. Cosmic chronometers redefinition
Following the same procedure as described in Camarena & Marra (2021), but for the CC likelihood,  , we obtain
 (19)
(19)
When applied to correlated data with a covariance matrix, the χ2 expression is redefined as
 (20)
(20)
where
 (21a)
(21a)
 (21b)
(21b)
 (21c)
(21c)
where Hi = H(zi, θ) represents the observational data points at each z, and Ei = E(zi, θ) denotes the theoretical predictions for E(z).
3.5. Combined analysis
In our analysis, we also consider the combined likelihood as follows:
 (22)
(22)
The  depends only on the total energy density and the interaction strength. It is important to note that the above χ2 is not normalized, meaning that its absolute value does not serve as a useful measure of the quality of the fit.
3.6. Datasets and priors
In this work, we consider the following datasets:
BAO. For BAO, we adopt the transversal angular dataset provided by Nunes et al. (2020). These points exhibit minimal dependence on the cosmological model, rendering them suitable for testing various DE models. While they are uncorrelated, the methodology’s minimal assumptions on cosmology result in larger errors compared to those obtained using the standard fiducial cosmology approach Bernui et al. (2023), Nunes & Bernui (2020).
SNeIa. For the SNeIa dataset, we use three different compilations, as described below:
-
PantheonPlus and SH0ES (labeled PP): The PantheonPlus dataset, along with its covariance, comprises 1701 light curves of 1550 spectroscopically confirmed SNeIa, from which distance modulus measurements have been derived Riess et al. (2022), Brout et al. (2022), Scolnic et al. (2022). Compiled across 18 different surveys, these light curves represent a significant enhancement over the initial Pantheon analysis, particularly at low redshifts1.
-
PantheonPlus with removed SH0ES calibration (labeled PPNoS): The PP dataset includes the SH0ES light curves for SNeIa with z < 0.01 along with their combined systematic covariance. To exclusively utilize the PantheonPlus dataset, we excluded all objects with z < 0.01 and removed their covariance from the overall covariance matrix.
-
Pantheon (labeled as P): For comparison purposes, we include the “old” Pantheon dataset along with its covariance matrix. This dataset comprises 1048 SNeIa luminosity measurements in the redshift range z ∈ (0.01, 2.3), binned into 40 points Scolnic et al. (2018). Additionally, we incorporate systematic errors provided by the binned covariance matrix2.
CC. The CC dataset is based on the differential ages of passive galaxies (cosmic chronometers) Moresco et al. (2012, 2016), Moresco (2015). We use the most recent version of the CC dataset, which includes the full covariance matrix accounting for systematic uncertainties stemming from the initial mass function, stellar library, and metallicity, which has been published in Moresco et al. (2020)3.
For likelihood maximization, we employed an affine-invariant nested sampler, as implemented in the open-source package PolychordHandley et al. (2015), and the results are presented using the GetDist package Lewis (2019). Convergence in Polychord is achieved when the posterior mass contained in the live points reaches p = 10−2 of the total calculated evidence. Throughout our analysis, we imposed flat priors as follows: Ωm, 0 ∈ [0, 1], ξ ∈ [ − 0.33, 1], w ∈ [ − 2, 0].
4. Results
In this section, we present the constraints on the interacting scenarios, namely ξCDM and wξCDM, using the combined datasets including CC, BAO, and various compilations of SNeIa as described in Sect. 3.6. After analytically marginalizing the parameters H0, rd, and MB, the free baseline parameters of the ξCDM model become Ωm, 0 and ξ, while for the wξCDM model, they are Ωm, 0, ξ, and w. Our key results are reported in Table 1 and in Figs. 1 and 2.
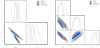 |
Fig. 1. Triangular plots showing the 2D joint and 1D marginalized posterior probability distributions for the free parameters of the ξCDM scenario (left panel) and the wξCDM scenario (right panel). |
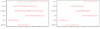 |
Fig. 2. Mean values and errors of the parameter ξ presented for the ξCDM and wξCDM models across the three SNeIa datasets. In most cases, the interaction term agrees with ξ = 0 within 1σ. The left panel illustrates the results under a uniform prior on the matter density Ωm, 0 ∈ [0, 1], while the right panel assumes a Gaussian prior on Ωm, 0 centered around the value obtained from Table 3 of Anchordoqui et al. (2021): |

Marginalized constraints (mean values with 68% CL uncertainties) on the free parameters of the interacting scenarios ξCDM and wξCDM, considering the joint analysis of the CC+BAO+SNeIa dataset for the three SNeIa samples considered.
To infer the constraints on the parameters of these two interacting scenarios, we performed three joint analyzes using three distinct SNeIa samples: PP, PPNoS, and P. This approach allows us to compare the results obtained across three different SNeIa datasets, which can be distinguished by their sample size and systematic astrophysical uncertainties. A similar comparison was conducted in Briffa et al. (2023), demonstrating the importance of examining how different SNeIa datasets impact the results when extended beyond ΛCDM.
As anticipated, we obtained the most precise fit values from the calibrated PantheonPlus and SH0ES (PP) dataset. Here, the inclusion of incredibly precise measurements from the SH0ES collaboration results in very narrow constraints. Conversely, both the PantheonPlus dataset without SH0ES (PPNoS) and the older Pantheon (P) datasets yield broader contours for Ωm, 0 and ξ (and w), accompanied by slightly less Gaussian convergence. It is important to note that while the marginalization procedure alleviates degeneracies or tensions between certain parameters, this may come at the expense of increased uncertainty in the posterior distribution.
We focus on the constraints on the coupling parameter ξ extracted from the two interacting scenarios examined in this study. Within the ξCDM framework, using the combined dataset CC+BAO+PP, we observe ξ = −0.21 ± 0.08 at 68% CL. In this scenario, energy flow from DE to CDM is indicated, resulting in an increase in the CDM energy density throughout the cosmic history. The result at the 95% CL yields ξ = −0.21 ± 0.12, corroborating evidence for ξ and consequently supporting the presence of an interaction in this context. For the present-day matter density, we obtain Ωm, 0 = 0.42 ± 0.03 at the 68% CL. However, it is noteworthy that this analysis exhibits a tendency towards a mean negative value of ξ (as discussed below), indicating a higher value of the total matter density compared to the ΛCDM model. Conversely, when the PPNoS dataset replaces PP in the joint analysis CC+BAO+PPNoS, we find ξ = −0.05 ± 0.10 at the 68% CL, indicating complete compatibility with the null hypothesis, that is, the ΛCDM model. For CC+BAO+PPNoS, we obtain Ωm, 0 = 0.35 ± 0.03 at the 68% CL. Lastly, for the combined dataset employing the Pantheon dataset (CC+BAO+P), we find ξ = 0.15 ± 0.13 at the 68% CL within the ξCDM framework, indicating the presence of a mild interaction in the dark sector that vanishes at the 95% CL. The matter density in this scenario closely resembles that of the PPNoS dataset, leading to Ωm, 0 = 0.33 ± 0.09 at the 68% CL.
Regarding the estimations of the Hubble constant, as highlighted in Dhawan et al. (2020), Brout et al. (2022), the local H0 constraint derived from the Cepheid distance ladder remains insensitive to models beyond the ΛCDM cosmology. However, the strong correlation between ξ and H0 is well established (as discussed in Zhai et al. 2023 and references therein). Consequently, during the marginalization process over H0 when conducting joint analyses with PP samples – which incorporate Cepheid distance measurements – it is expected that the statistical information regarding the correlation with H0 will be preserved, thereby maintaining a tendency for ξ < 0 at the 68% CL. Conversely, the analysis using the P samples does not extend to cover the low redshifts of the primary distance indicators. Therefore, in this analysis, a tendency for ξ < 0 is not expected. Interestingly, a notable trend towards ξ > 0 is observed with P samples, suggesting that SNeIa samples lacking primary distance indicators at very low redshifts may indicate a tendency for the coupling parameter to change sign. However, the analysis with PPNoS, which represents an updated version of P samples with an increased sample size, demonstrates complete compatibility with ξ = 0.
Now, shifting our focus to the wξCDM scenario, we do not find any evidence supporting ξ ≠ 0 in the context of the joint analyses CC+BAO+PP, CC+BAO+PPNoS, and CC+BAO+P. It is worth noting that when employing a narrower prior on Ωm, 0 ∈ [0.2, 0.4], as detailed in Appendix A, we find some tentative evidence supporting an interaction in the dark sector at more than 95% confidence level (CL) for CC+BAO+P (ξ = 0.18 ± 0.17 at 95% CL). Furthermore, focusing on the dark energy equation of state, w, we observe that for the joint analyzes with the PPNoS and P datasets, the constraints are fully compatible with w = −1. However, in the case of the joint analysis with the PP dataset, we find indications of a quintessence-type behavior at the 68% CL.
It is noteworthy that in the wCDM model, a tendency towards w > −1 was highlighted by Brout et al. (2022) based solely on the PP analysis. With the addition of CC data, which can also lead to values of w tending towards w > −1 in the wCDM model Escamilla et al. (2024), we observe that this preference for w > −1 persists in our analysis within the framework of the wξCDM model as well.
To examine the impact of the prior on the results, we performed a joint analysis using the CC+BAO+SNeIa dataset for the three SNeIa samples considered, assuming a Gaussian prior on the matter density Ωm, 0 centered around the CMB point from Table 3 of Anchordoqui et al. (2021); that is,  , which was derived under the assumption of an IDE model. The results (presented in Table 2) reveal that for the CMB prior, indications of IDE at the 68% CL are observed for the ξCDM model with the CC+BAO+PP dataset and for the CC+BAO+P dataset. Regarding the wξCDM model, evidence for IDE is obtained across all datasets. At the 95% CL, evidence for IDE is observed for ξCDM with the CC+BAO+P and CC+BAO+PP datasets, and for wξCDM with the CC+BAO+P dataset.
Similar to Table 1, but in this case, we are assuming a Gaussian prior on the matter density Ωm, 0 centered around the CMB value from Table 3 of Anchordoqui et al. (2021):  at 68% CL.
Finally, in Fig. 2, we compare the mean values and errors for ξ at the 68% CL under two different priors on Ωm, 0: the standard uniform flat prior and a Gaussian prior corresponding to the CMB prior discussed above. It is evident that, while changing the prior reduces the errors, the final mean values remain similar.
An important point to note is the integration of E(z) for negative values of ξ, which may lead to numerical instabilities in nontrivial regions of the parameter space. For this reason, our prior on ξ is not symmetric with respect to zero. We chose a left boundary for ξ to avoid numerical singularities arising from E(z) becoming imaginary. Additionally, we conducted further tests using a normalized χ2 and a Cholesky decomposition of the covariance matrix for the PPnoS dataset, which provides an alternative method of computing the inverse matrix. However, neither method resulted in improved convergence or smaller errors.
To compare the different models using statistical measurements assuming the defined datasets, we employed the Akaike information criterion (AIC), the Bayesian information criterion (BIC), and the Bayes factor (BF; Liddle 2007; Staicova & Benisty 2022). The AIC criterion is defined as:
 (23)
(23)
where ℒmax represents the maximum likelihood of the data under consideration, Ntot is the total number of data points, and k is the number of parameters. The BIC criterion is defined as
 (24)
(24)
From these definitions, we calculated ΔICmodel = ICΛCDM − ICmodel, where our base model is the flat ΛCDM. The model with the minimal AIC is considered the best Jeffreys (1939), with a positive ΔIC giving preference to the IDE model, and a negative ΔIC favoring ΛCDM, with |ΔIC|≥2 signifying a possible tension. The logarithmic BF is defined as:
![Mathematical equation: $$ \begin{aligned} \ln (B_{0j}) = \ln \left[\frac{p(d|M_0)}{p(d|M_j)}\right], \end{aligned} $$](/articles/aa/full_html/2024/08/aa49883-24/aa49883-24-eq44.gif) (25)
(25)
where p(d|Mj) is the Bayesian evidence for model Mj. The evidence is calculated numerically by Polychord. In Table 3, we set M0 = MΛCDM, which we compare to the IDE models. According to the revised Jeffrey’s scale Jeffreys (1939), |ln(B0j)| < 1 is inconclusive for any of the models, negative values support the IDE model, and positive values favor the ΛCDM model.
Summary of the information criteria for the ξCDM and wξCDM models compared to the flat ΛCDM model, utilizing the combined dataset CC+BAO+SNeIa with consideration of three distinct samples of SNeIa.
Our results are summarized in Table 3. For all three datasets, we compared the ΛCDM model with the IDE models we consider. We observe that the AIC and BIC criteria strongly favor ΛCDM. The only weak support is for ξCDM PP. The BF mostly favors ΛCDM, with the notable exception of ξCDM PP. In this case, we also observe evidence for IDE from ξ at 95% CL. The other case in which there is a preference for ξCDM at 68% CL, which is Pantheon, shows no statistical preference for ξCDM, but also inconclusive evidence for ΛCDM. Thus, from a statistical standpoint, for most measures, no notable preference is observed in any of the present interacting scenarios. However, the results are sensitive to the underlying interacting model.
5. Discussion and future prospects
The interaction between DM and DE is a well-known cosmological scenario that has garnered enormous attention in the community. As explored in the literature, IDE models play an effective role in reconciling the H0 tension, and this reconciliation is related to the underlying interacting model and its parameters. Additionally, parameters such as the sound horizon, rd, and the absolute magnitude, MB, are also related to the H0 tension. Consequently, all three parameters – H0, rd, and MB – are dependent on the interacting parameters. In this work, we investigated an interacting model using a heuristic approach that allows us to examine the intrinsic nature of the model parameters without directly linking them to H0, rd, or MB. We employed the marginalization method to remove the variables H0, MB, and rd, with the aim being to examine the intrinsic nature of the interaction between the dark components. We used a transversal BAO dataset, cosmic chronometers (CC) whilst accounting for covariance, and different compilations of SNeIa datasets – PantheonPlus and SH0ES, PantheonPlus and SH0ES without SH0ES prior (uncalibrated and calibrated), and the old Pantheon – for the purpose of comparing results.
Considering a well-known interaction function of the form Q = 3HξρDE, we investigated two distinct interacting scenarios, labeled ξCDM and wξCDM. We constrained both scenarios using the combined datasets CC+BAO+PP, CC+BAO+PPNoS, and CC+BAO+P, and the results are summarized in Table 1 and Fig. 1. Our results show that, for the uncalibrated PantheonPlus and SH0ES (i.e., PPNoS), when combined with CC and BAO, we do not find any evidence of ξ ≠ 0 in either the ξCDM (ξ = −0.05 ± 0.1 at 68% CL, CC+BAO+PPNoS) or wξCDM (ξ = 0.02 ± 0.24 at 68% CL, CC+BAO+PPNoS) scenario. In the calibrated case (PP), evidence of ξ ≠ 0 is found in ξCDM at more than 68% CL (ξ = −0.21 ± 0.08 for CC+BAO+PP), indicating a flow of energy from DE to DM. This is further confirmed by the high value of the matter density parameter (Ωm, 0 = 0.42 ± 0.03 at 68% CL, CC+BAO+PP), which remains at 95% CL. However, for the wξCDM scenario, we do not find any such statistical evidence, as reflected by the coupling parameter ξ = −0.02 ± 0.17 at 68% CL (CC+BAO+PP). On the other hand, when the Pantheon dataset is used (i.e., for the combined dataset CC+BAO+P), we obtain ξ = 0.15 ± 0.13 at 68% CL for ξCDM and ξ = 0.09 ± 0.25 at 68% CL for wξCDM, indicating a preference for an interaction between DE and CDM for ξCDM. However, within the 95% CL, the evidence for ξ ≠ 0 diminishes, eventually recovering ΛCDM and wCDM models, respectively. Finally, we observe that w is closest to ΛCDM for the uncalibrated PantheonPlus and SH0ES dataset.
The marginalization procedure yields interesting new results that exhibit a relatively strong dependence on whether the SNeIa dataset is calibrated with the Cepheids or not. Additionally, we observe significant differences between the Pantheon and PantheonPlus datasets in terms of the uncertainties, indicating that PP and PPNoS are more suitable for this kind of study. While IDE demonstrates exciting potential to alleviate the Hubble tension, further studies on the choice of datasets and parameter space are needed to confirm its contribution. Notably, in this work, we exclude the CMB contribution and only use the transversal BAO dataset, which, while more suitable due to its independence of fiducial cosmology, leads to larger errors compared to the newest mixed angular and radial BAO datasets. In summary, our results imply that the marginalization methodology adopted to examine this particular interacting model could provide new insights if applied to other promising interacting models and with more datasets.
Acknowledgments
D.B. thanks the Carl-Wilhelm Fueck Stiftung and the Margarethe und Herbert Puschmann Stiftung. S.P. acknowledges the financial support from the Department of Science and Technology (DST), Govt. of India under the Scheme “Fund for Improvement of S&T Infrastructure (FIST)” [File No. SR/FST/MS-I/2019/41]. D.S. acknowledges the support of Bulgarian National Science Fund No. KP-06-N58/5. E.D.V. acknowledges support from the Royal Society through a Royal Society Dorothy Hodgkin Research Fellowship. R.C.N. thanks the financial support from the Conselho Nacional de Desenvolvimento Científico e Tecnologico (CNPq, National Council for Scientific and Technological Development) under the project No. 304306/2022-3, and the Fundação de Amparo à pesquisa do Estado do RS (FAPERGS, Research Support Foundation of the State of RS) for partial financial support under the project No. 23/2551-0000848-3. This article is based upon work from the COST Action CA21136 “Addressing observational tensions in cosmology with systematics and fundamental physics” (CosmoVerse), supported by COST (European Cooperation in Science and Technology).
References
- Abdalla, E., Abellán, G. F., Aboubrahim, A., et al. 2022, J. High Energy Astrophys., 34, 49 [NASA ADS] [CrossRef] [Google Scholar]
- Addison, G. E., Hinshaw, G., & Halpern, M. 2013, MNRAS, 436, 1674 [NASA ADS] [CrossRef] [Google Scholar]
- Aloni, D., Berlin, A., Joseph, M., Schmaltz, M., & Weiner, N. 2022, Phys. Rev. D, 105, 123516 [CrossRef] [Google Scholar]
- Amendola, L. 2000, Phys. Rev. D, 62, 043511 [NASA ADS] [CrossRef] [Google Scholar]
- An, R., Feng, C., & Wang, B. 2018, JCAP, 02, 038 [CrossRef] [Google Scholar]
- Anagnostopoulos, F. K., & Basilakos, S. 2018, Phys. Rev. D, 97, 063503 [NASA ADS] [CrossRef] [Google Scholar]
- Anchordoqui, L. A., Di Valentino, E., Pan, S., & Yang, W. 2021, J. High Energy Astrophys., 32, 28 [NASA ADS] [CrossRef] [Google Scholar]
- Aubourg, E., et al. (BOSS Collaboration) 2015, Phys. Rev. D, 92, 123516 [NASA ADS] [CrossRef] [Google Scholar]
- Barrow, J. D., & Clifton, T. 2006, Phys. Rev. D, 73, 103520 [NASA ADS] [CrossRef] [Google Scholar]
- Basilakos, S., & Nesseris, S. 2016, Phys. Rev. D, 94, 123525 [NASA ADS] [CrossRef] [Google Scholar]
- Benisty, D. 2021, Phys. Dark Univ., 31, 100766 [NASA ADS] [CrossRef] [Google Scholar]
- Benisty, D. 2023, PoS, CORFU2022, 259 [Google Scholar]
- Bernui, A., Di Valentino, E., Giarè, W., Kumar, S., & Nunes, R. C. 2023, Phys. Rev. D, 107, 103531 [CrossRef] [Google Scholar]
- Bolotin, Y. L., Kostenko, A., Lemets, O. A., & Yerokhin, D. A. 2014, Int. J. Mod. Phys. D, 24, 1530007 [Google Scholar]
- Briffa, R., Escamilla-Rivera, C., Levi Said, J., & Mifsud, J. 2023, MNRAS, 522, 6024 [CrossRef] [Google Scholar]
- Brout, D., Scolnic, D., Popovic, B., et al. 2022, ApJ, 938, 110 [NASA ADS] [CrossRef] [Google Scholar]
- Cai, R.-G., & Wang, A. 2005, JCAP, 03, 002 [CrossRef] [Google Scholar]
- Calderón, R., Gannouji, R., L’Huillier, B., & Polarski, D. 2021, Phys. Rev. D, 103, 023526 [CrossRef] [Google Scholar]
- Camarena, D., & Marra, V. 2021, MNRAS, 504, 5164 [NASA ADS] [CrossRef] [Google Scholar]
- Chen, X.-M., Gong, Y., Saridakis, E. N., & Gong, Y. 2014, Int. J. Theor. Phys., 53, 469 [NASA ADS] [CrossRef] [Google Scholar]
- Clemson, T., Koyama, K., Zhao, G.-B., Maartens, R., & Valiviita, J. 2012, Phys. Rev. D, 85, 043007 [NASA ADS] [CrossRef] [Google Scholar]
- Copeland, E. J., Sami, M., & Tsujikawa, S. 2006, Int. J. Mod. Phys. D, 15, 1753 [NASA ADS] [CrossRef] [Google Scholar]
- Cuceu, A., Farr, J., Lemos, P., & Font-Ribera, A. 2019, JCAP, 10, 044 [CrossRef] [Google Scholar]
- Cuesta, A. J., Verde, L., Riess, A., & Jimenez, R. 2015, MNRAS, 448, 3463 [NASA ADS] [CrossRef] [Google Scholar]
- Deng, H.-K., & Wei, H. 2018, Eur. Phys. J. C, 78, 755 [NASA ADS] [CrossRef] [Google Scholar]
- Dhawan, S., Brout, D., Scolnic, D., et al. 2020, ApJ, 894, 54 [Google Scholar]
- Di Pietro, E., & Claeskens, J.-F. 2003, MNRAS, 341, 1299 [NASA ADS] [CrossRef] [Google Scholar]
- Di Valentino, E., Melchiorri, A., & Mena, O. 2017, Phys. Rev. D, 96, 043503 [Google Scholar]
- Di Valentino, E., Melchiorri, A., Mena, O., & Vagnozzi, S. 2020a, Phys. Dark Univ., 30, 100666 [NASA ADS] [CrossRef] [Google Scholar]
- Di Valentino, E., Melchiorri, A., Mena, O., & Vagnozzi, S. 2020b, Phys. Rev. D, 101, 063502 [Google Scholar]
- Di Valentino, E., Anchordoqui, L. A., Akarsu, Ö., et al. 2021a, Astropart. Phys., 131, 102605 [NASA ADS] [CrossRef] [Google Scholar]
- Di Valentino, E., Anchordoqui, L. A., Akarsu, Ö., et al. 2021b, Astropart. Phys., 131, 102604 [NASA ADS] [CrossRef] [Google Scholar]
- Di Valentino, E., Anchordoqui, L. A., Akarsu, Ö., et al. 2021c, Astropart. Phys., 131, 102607 [NASA ADS] [CrossRef] [Google Scholar]
- Di Valentino, E., Mena, O., Pan, S., et al. 2021d, Class. Quant. Grav., 38, 153001 [NASA ADS] [CrossRef] [Google Scholar]
- Di Valentino, E., Melchiorri, A., Mena, O., Pan, S., & Yang, W. 2021e, MNRAS, 502, L23 [NASA ADS] [CrossRef] [Google Scholar]
- Escamilla, L. A., Akarsu, O., Di Valentino, E., & Vazquez, J. A. 2023, JCAP, 11, 051 [CrossRef] [Google Scholar]
- Escamilla, L. A., Giarè, W., Valentino, E. D., Nunes, R. C., & Vagnozzi, S. 2024, JCAP, 05, 091 [CrossRef] [Google Scholar]
- Escudero, H. G., Kuo, J.-L., Keeley, R. E., & Abazajian, K. N. 2022, Phys. Rev. D, 106, 103517 [NASA ADS] [CrossRef] [Google Scholar]
- Faraoni, V., Dent, J. B., & Saridakis, E. N. 2014, Phys. Rev. D, 90, 063510 [NASA ADS] [CrossRef] [Google Scholar]
- Frieman, J., Turner, M., & Huterer, D. 2008, ARA&A, 46, 385 [NASA ADS] [CrossRef] [Google Scholar]
- Gao, L.-Y., Zhao, Z.-W., Xue, S.-S., & Zhang, X. 2021, JCAP, 07, 005 [CrossRef] [Google Scholar]
- Gavela, M. B., Lopez Honorez, L., Mena, O., & Rigolin, S. 2010, JCAP, 11, 044 [CrossRef] [Google Scholar]
- Giarè, W., Sabogal, M. A., Nunes, R. C., & Di Valentino, E. 2024, ArXiv e-prints [arXiv:2404.15232] [Google Scholar]
- Handley, W. J., Hobson, M. P., & Lasenby, A. N. 2015, MNRAS, 450, L61 [NASA ADS] [CrossRef] [Google Scholar]
- Hoerning, G. A., Landim, R. G., Ponte, L. O., et al. 2023, ArXiv e-prints [arXiv:2308.05807] [Google Scholar]
- Jedamzik, K., Pogosian, L., & Zhao, G.-B. 2021, Commun. Phys., 4, 123 [NASA ADS] [CrossRef] [Google Scholar]
- Jeffreys, H. 1939, The Theory of Probability (Oxford: Oxford University Press) [Google Scholar]
- Johnson, J. P., & Shankaranarayanan, S. 2021, Phys. Rev. D, 103, 023510 [NASA ADS] [CrossRef] [Google Scholar]
- Johnson, J. P., Sangwan, A., & Shankaranarayanan, S. 2022, JCAP, 01, 024 [CrossRef] [Google Scholar]
- Joseph, M., Aloni, D., Schmaltz, M., Sivarajan, E. N., & Weiner, N. 2023, Phys. Rev. D, 108, 023520 [NASA ADS] [CrossRef] [Google Scholar]
- Kamionkowski, M., & Riess, A. G. 2023, Ann. Rev. Nucl. Part. Sci., 73, 153 [NASA ADS] [CrossRef] [Google Scholar]
- Khachatryan, H. G., & Stepanian, A. 2020, A&A, 642, L9 [NASA ADS] [CrossRef] [EDP Sciences] [Google Scholar]
- Khalife, A. R., Zanjani, M. B., Galli, S., et al. 2024, JCAP, 2024, 059 [CrossRef] [Google Scholar]
- Knox, L., & Millea, M. 2020, Phys. Rev. D, 101, 043533 [Google Scholar]
- Lazkoz, R., Nesseris, S., & Perivolaropoulos, L. 2005, JCAP, 11, 010 [CrossRef] [Google Scholar]
- Lewis, A. 2019, ArXiv e-prints [arXiv:1910.13970] [Google Scholar]
- Li, Y.-H., & Zhang, X. 2014, Phys. Rev. D, 89, 083009 [NASA ADS] [CrossRef] [Google Scholar]
- Li, Y.-H., Zhang, J.-F., & Zhang, X. 2014, Phys. Rev. D, 90, 123007 [NASA ADS] [CrossRef] [Google Scholar]
- Liddle, A. R. 2007, MNRAS, 377, L74 [NASA ADS] [Google Scholar]
- Liu, Y., Liao, S., Liu, X., et al. 2022, MNRAS, 511, 3076 [NASA ADS] [CrossRef] [Google Scholar]
- Lombriser, L. 2019, Phys. Lett. B, 797, 134804 [NASA ADS] [CrossRef] [Google Scholar]
- Lucca, M. 2021, Phys. Dark Univ., 34, 100899 [NASA ADS] [CrossRef] [Google Scholar]
- Mifsud, J., & Van De Bruck, C. 2017, JCAP, 11, 001 [NASA ADS] [Google Scholar]
- Moresco, M. 2015, MNRAS, 450, L16 [NASA ADS] [CrossRef] [Google Scholar]
- Moresco, M., Cimatti, A., Jimenez, R., et al. 2012, JCAP, 08, 006 [CrossRef] [Google Scholar]
- Moresco, M., Pozzetti, L., Cimatti, A., et al. 2016, JCAP, 05, 014 [CrossRef] [Google Scholar]
- Moresco, M., Jimenez, R., Verde, L., Cimatti, A., & Pozzetti, L. 2020, ApJ, 898, 82 [NASA ADS] [CrossRef] [Google Scholar]
- Naidoo, K., Jaber, M., Hellwing, W. A., & Bilicki, M. 2024, Phys. Rev. D., 109, 083511 [NASA ADS] [CrossRef] [Google Scholar]
- Nesseris, S., & Perivolaropoulos, L. 2004, Phys. Rev. D, 70, 043531 [NASA ADS] [CrossRef] [Google Scholar]
- Nunes, R. C., & Bernui, A. 2020, Eur. Phys. J. C, 80, 1025 [NASA ADS] [CrossRef] [Google Scholar]
- Nunes, R. C., & Vagnozzi, S. 2021, MNRAS, 505, 5427 [NASA ADS] [CrossRef] [Google Scholar]
- Nunes, R. C., Pan, S., & Saridakis, E. N. 2016, Phys. Rev. D, 94, 023508 [NASA ADS] [CrossRef] [Google Scholar]
- Nunes, R. C., Yadav, S. K., Jesus, J. F., & Bernui, A. 2020, MNRAS, 497, 2133 [NASA ADS] [CrossRef] [Google Scholar]
- Pan, S., & Yang, W. 2023, ArXiv e-prints [arXiv:2310.07260] [Google Scholar]
- Pan, S., Bhattacharya, S., & Chakraborty, S. 2015, MNRAS, 452, 3038 [CrossRef] [Google Scholar]
- Pan, S., Mukherjee, A., & Banerjee, N. 2018, MNRAS, 477, 1189 [CrossRef] [Google Scholar]
- Pan, S., Yang, W., Di Valentino, E., Saridakis, E. N., & Chakraborty, S. 2019, Phys. Rev. D, 100, 103520 [NASA ADS] [CrossRef] [Google Scholar]
- Pan, S., Sharov, G. S., & Yang, W. 2020a, Phys. Rev. D, 101, 103533 [NASA ADS] [CrossRef] [Google Scholar]
- Pan, S., de Haro, J., Yang, W., & Amorós, J. 2020b, Phys. Rev. D, 101, 123506 [NASA ADS] [CrossRef] [Google Scholar]
- Perivolaropoulos, L. 2005, Phys. Rev. D, 71, 063503 [NASA ADS] [CrossRef] [Google Scholar]
- Perlmutter, S., Aldering, G., Goldhaber, G., et al. 1999, ApJ, 517, 565 [Google Scholar]
- Planck Collaboration VI. 2020, A&A, 641, A6 [Erratum: A&A 652, C4 (2021)] [NASA ADS] [CrossRef] [EDP Sciences] [Google Scholar]
- Poulin, V., Boddy, K. K., Bird, S., & Kamionkowski, M. 2018, Phys. Rev. D, 97, 123504 [Google Scholar]
- Pourtsidou, A., & Tram, T. 2016, Phys. Rev. D, 94, 043518 [CrossRef] [Google Scholar]
- Riess, A. G. 2019, Nat. Rev. Phys., 2, 10 [NASA ADS] [CrossRef] [Google Scholar]
- Riess, A. G., Filippenko, A. V., Challis, P., et al. 1998, AJ, 116, 1009 [Google Scholar]
- Riess, A. G., Yuan, W., Macri, L. M., et al. 2022, ApJ, 934, L7 [NASA ADS] [CrossRef] [Google Scholar]
- Salvatelli, V., Marchini, A., Lopez-Honorez, L., & Mena, O. 2013, Phys. Rev. D, 88, 023531 [NASA ADS] [CrossRef] [Google Scholar]
- Salvatelli, V., Said, N., Bruni, M., Melchiorri, A., & Wands, D. 2014, Phys. Rev. Lett., 113, 181301 [NASA ADS] [CrossRef] [Google Scholar]
- Scolnic, D. M., Jones, D. O., Rest, A., et al. 2018, ApJ, 859, 101 [NASA ADS] [CrossRef] [Google Scholar]
- Scolnic, D., Brout, D., Carr, A., et al. 2022, ApJ, 938, 113 [NASA ADS] [CrossRef] [Google Scholar]
- Silva, E., Zúñiga Bolaño, U., Nunes, R. C., & Di Valentino, E. 2024, ArXiv e-prints [arXiv:2403.19590] [Google Scholar]
- Staicova, D., & Benisty, D. 2022, A&A, 668, A135 [NASA ADS] [CrossRef] [EDP Sciences] [Google Scholar]
- Vagnozzi, S. 2023, Universe, 9, 393 [NASA ADS] [CrossRef] [Google Scholar]
- Valiviita, J., Majerotto, E., & Maartens, R. 2008, JCAP, 07, 020 [CrossRef] [Google Scholar]
- Valiviita, J., Maartens, R., & Majerotto, E. 2010, MNRAS, 402, 2355 [CrossRef] [Google Scholar]
- Verde, L., Treu, T., & Riess, A. G. 2019, Nat. Astron., 3, 891 [Google Scholar]
- Visinelli, L., Vagnozzi, S., & Danielsson, U. 2019, Symmetry, 11, 1035 [NASA ADS] [CrossRef] [Google Scholar]
- Wagner, J. 2022, Proceedings of Corfu Summer Institute 2022 “School and Workshops on Elementary Particle Physics and Gravity”, PoS(CORFU2022), https://api.semanticscholar.org/CorpusID:247596836 [Google Scholar]
- Wang, B., Abdalla, E., Atrio-Barandela, F., & Pavon, D. 2016, Rept. Prog. Phys., 79, 096901 [NASA ADS] [CrossRef] [Google Scholar]
- Wang, Y., Pogosian, L., Zhao, G.-B., & Zucca, A. 2018, ApJ, 869, L8 [NASA ADS] [CrossRef] [Google Scholar]
- Wang, B., Abdalla, E., Atrio-Barandela, F., & Pavón, D. 2024, Rep. Prog. Phys., 87, 036901 [NASA ADS] [CrossRef] [Google Scholar]
- Weinberg, S. 1989, Rev. Mod. Phys., 61, 1 [NASA ADS] [CrossRef] [Google Scholar]
- Yang, W., & Xu, L. 2014a, Phys. Rev. D, 89, 083517 [NASA ADS] [CrossRef] [Google Scholar]
- Yang, W., & Xu, L. 2014b, JCAP, 08, 034 [CrossRef] [Google Scholar]
- Yang, W., & Xu, L. 2014c, Phys. Rev. D, 90, 083532 [NASA ADS] [CrossRef] [Google Scholar]
- Yang, W., Li, H., Wu, Y., & Lu, J. 2016, JCAP, 10, 007 [NASA ADS] [CrossRef] [Google Scholar]
- Yang, W., Pan, S., & Mota, D. F. 2017, Phys. Rev. D, 96, 123508 [NASA ADS] [CrossRef] [Google Scholar]
- Yang, W., Pan, S., & Barrow, J. D. 2018a, Phys. Rev. D, 97, 043529 [NASA ADS] [CrossRef] [Google Scholar]
- Yang, W., Mukherjee, A., Di Valentino, E., & Pan, S. 2018b, Phys. Rev. D, 98, 123527 [NASA ADS] [CrossRef] [Google Scholar]
- Yang, W., Pan, S., Herrera, R., & Chakraborty, S. 2018c, Phys. Rev. D, 98, 043517 [NASA ADS] [CrossRef] [Google Scholar]
- Yang, W., Pan, S., Di Valentino, E., et al. 2018d, JCAP, 09, 019 [CrossRef] [Google Scholar]
- Yang, W., Pan, S., & Paliathanasis, A. 2019a, MNRAS, 482, 1007 [NASA ADS] [Google Scholar]
- Yang, W., Pan, S., Xu, L., & Mota, D. F. 2019b, MNRAS, 482, 1858 [NASA ADS] [CrossRef] [Google Scholar]
- Yang, W., Mena, O., Pan, S., & Di Valentino, E. 2019c, Phys. Rev. D, 100, 083509 [NASA ADS] [CrossRef] [Google Scholar]
- Yang, W., Pan, S., Nunes, R. C., & Mota, D. F. 2020, JCAP, 04, 008 [CrossRef] [Google Scholar]
- Zhai, Y., Giarè, W., van de Bruck, C., et al. 2023, JCAP, 07, 032 [CrossRef] [Google Scholar]
- Zhao, Y., Liu, Y., Liao, S., et al. 2023, MNRAS, 523, 5962 [NASA ADS] [CrossRef] [Google Scholar]
Appendix A: Assuming smaller priors on the matter density
For completeness, here we report the marginalized constraints on the ξCDM and wξCDM scenarios considering a smaller prior on Ωm, 0 ∈ [0.2, 0.4]. Table A.1 and Fig. A.1 summarize the results on these two interacting scenarios. In this case, we observe evidence of interaction within ξCDM for CC+BAO+PP and CC+BAO+P datasets, while for wξCDM, evidence is found only for CC+BAO+P. Within the 95% CL, the results that remain are ξ = 0.17 ± 0.15 for ξCDM and ξ = 0.18 ± 0.17 for wξCDM, both for the CC+BAO+P dataset. For the rest, the results are consistent with no interaction within 95% CL.
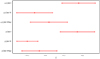 |
Fig. A.1. Mean values and errors of the parameter ξ for the ξCDM and wξCDM models for the three SNeIa datasets with a uniform prior on the matter density parameter Ωm, 0 ∈ [0.2, 0.4]. In most cases, the interaction agrees with ξ = 0 and this is consistent within 1σ uncertainty. |
Marginalized constraints (mean values with their 68% CL uncertainties) on the free parameters of the interacting scenarios ξCDM and wξCDM considering the joint analysis of the CC+BAO+SN dataset for the three SN samples we consider, with the prior Ωm, 0 ∈ [0.2, 0.4].
All Tables
Marginalized constraints (mean values with 68% CL uncertainties) on the free parameters of the interacting scenarios ξCDM and wξCDM, considering the joint analysis of the CC+BAO+SNeIa dataset for the three SNeIa samples considered.
Similar to Table 1, but in this case, we are assuming a Gaussian prior on the matter density Ωm, 0 centered around the CMB value from Table 3 of Anchordoqui et al. (2021): at 68% CL.
Summary of the information criteria for the ξCDM and wξCDM models compared to the flat ΛCDM model, utilizing the combined dataset CC+BAO+SNeIa with consideration of three distinct samples of SNeIa.
Marginalized constraints (mean values with their 68% CL uncertainties) on the free parameters of the interacting scenarios ξCDM and wξCDM considering the joint analysis of the CC+BAO+SN dataset for the three SN samples we consider, with the prior Ωm, 0 ∈ [0.2, 0.4].
All Figures
|
Fig. 1. Triangular plots showing the 2D joint and 1D marginalized posterior probability distributions for the free parameters of the ξCDM scenario (left panel) and the wξCDM scenario (right panel). |
| In the text | |
|
Fig. 2. Mean values and errors of the parameter ξ presented for the ξCDM and wξCDM models across the three SNeIa datasets. In most cases, the interaction term agrees with ξ = 0 within 1σ. The left panel illustrates the results under a uniform prior on the matter density Ωm, 0 ∈ [0, 1], while the right panel assumes a Gaussian prior on Ωm, 0 centered around the value obtained from Table 3 of Anchordoqui et al. (2021): |
| In the text | |
|
Fig. A.1. Mean values and errors of the parameter ξ for the ξCDM and wξCDM models for the three SNeIa datasets with a uniform prior on the matter density parameter Ωm, 0 ∈ [0.2, 0.4]. In most cases, the interaction agrees with ξ = 0 and this is consistent within 1σ uncertainty. |
| In the text | |
Current usage metrics show cumulative count of Article Views (full-text article views including HTML views, PDF and ePub downloads, according to the available data) and Abstracts Views on Vision4Press platform.
Data correspond to usage on the plateform after 2015. The current usage metrics is available 48-96 hours after online publication and is updated daily on week days.
Initial download of the metrics may take a while.