| Issue |
A&A
Volume 688, August 2024
|
|
|---|---|---|
| Article Number | A181 | |
| Number of page(s) | 14 | |
| Section | Stellar atmospheres | |
| DOI | https://doi.org/10.1051/0004-6361/202449737 | |
| Published online | 20 August 2024 | |
X-raying the ζ Tau binary system
1
Groupe d’Astrophysique des Hautes Energies, STAR, Université de Liège, Quartier Agora (B5c, Institut d’Astrophysique et de Géophysique),
Allée du 6 Août 19c,
4000
Sart Tilman, Liège,
Belgium
e-mail: This email address is being protected from spambots. You need JavaScript enabled to view it.
2
Université de Strasbourg, CNRS,
Observatoire Astronomique de Strasbourg, 11 rue de l’Université, UMR 7550,
67000
Strasbourg,
France
3
NSF OIR Lab,
950 N Cherry Ave,
Tucson,
AZ
85721,
USA
4
Hamburger Sternwarte, University of Hamburg,
Gojenbergsweg 112,
21029
Hamburg,
Germany
Received:
26
February
2024
Accepted:
19
June
2024
Abstract
Context. The Be star ζ Tau was recently reported to be a γ Cas analog; that is, it displays an atypical (bright and hard) X-ray emission. The origin of these X-rays remains debated.
Aims. The first X-ray observations indicated a very large absorption of the hot plasma component (NH ~ 1023 cm−2). This is most probably related to the edge-on configuration of the ζ Tau disk. If the X-ray emission arises close to the companion, an orbital modulation of the absorption could be detected as the disk comes in and out of the line of sight.
Methods. New XMM-Newton data were obtained to characterize the high-energy properties of ζ Tau in more detail. They are complemented by previous Chandra and SRG/eROSITA observations as well as by optical spectroscopy and TESS photometry.
Results. The high-quality XMM-Newton data reveal the presence of a faint soft X-ray emission, which appears in line with that recorded for non-γ Cas Be stars. In addition, ζ Tau exhibits significant short-term variability at all energies, with larger amplitudes at lower frequencies (“red noise”), as is found in X-ray data of other γ Cas stars. Transient variability (softness dip, low-frequency signal) may also be detected at some epochs. In addition, between X-ray exposures, large variations in the spectra are detected in the 1.5–4 keV energy band. They are due to large changes in absorption toward the hottest (9 keV) plasma. These changes are not correlated with either the orbital phase or the depth of the shell absorption of the Hα line. These observed properties are examined in the light of proposed γ Cas models.
Key words: stars: emission-line, Be / stars: individual: ζ Tau / X-rays: stars
F.R.S.-FNRS Senior Research Associate.
© The Authors 2024
 Open Access article, published by EDP Sciences, under the terms of the Creative Commons Attribution License (https://creativecommons.org/licenses/by/4.0), which permits unrestricted use, distribution, and reproduction in any medium, provided the original work is properly cited.
This article is published in open access under the Subscribe to Open model. This email address is being protected from spambots. You need JavaScript enabled to view it. to support open access publication.
1 Introduction
A prominent star in the night sky, ζ Tau (B1Ve, V = 3.03) has been known for more than a century to be a binary system with a P ~ 133 days orbit (see Ruždjak et al. 2009 and references therein). Its companion is a low-mass (~1 M⊙) object of unknown nature that could be a hot stripped Helium star or a white dwarf (WD). Such low-mass companions appear common for Be stars (e.g. Wang et al. 2021; Nazé et al. 2022a). In fact, in the current paradigm, they should naturally result from binary interactions that led to the formation of the fast-rotating Be star (Pols et al. 1991; van Bever & Vanbeveren 1997; Shao & Li 2014).
The “shell” profile of the Hα emission line of ζ Tau, with its prominent central absorption, suggests a high inclination for its circumstellar disk. Values of 70–90° have been derived using Hα fitting, polarimetric analyses, and/or interferometric measurements (Quirrenbach et al. 1997; Tycner et al. 2004; Grundstrom & Gies 2006; Gies et al. 2007; Carciofi et al. 2009; Touhami et al. 2013; Cochetti et al. 2019). As is common for Be stars, the usual disk tracer, the Hα profile, evolves over decades, with minimal emissions being notably recorded at the end of the 1980s and around 2013 (Ruždjak et al. 2009; Pollmann 2017). In addition, changes in the violet-to-red (V/R) peak ratio and/or the central absorption strength have also been detected (Ruždjak et al. 2009; Štefl et al. 2009; Nazé et al. 2022c). A complicated profile, with multiple emission peaks, is also sometimes observed (Ruždjak et al. 2009; Štefl et al. 2009). It can be noted that such profiles can be interpreted as either triple emissions or a double absorption (Štefl et al. 2009). In the 1990s and 2000s, the Hα line of ζ Tau presented a stable cycle of about 1400 days. It was interpreted as the effect of a precessing disk (Schaefer et al. 2010) or of a one-arm spiral oscillation in a viscous disk (Carciofi et al. 2009). More recently, the variations changed, with little V/R variability but a strong modulation of the central absorption depth (Nazé et al. 2022c). Contrary to older observations, no periodicity was detected; rather, there appears to be some cyclicity over timescales of hundreds of days.
The X-ray emission of ζ Tau was examined only recently. Our study of Be+sdOB binaries or candidates used an archival Chandra 10 ks-exposure (ObsID = 26239), in which ζ Tau appeared heavily piled-up1 (Nazé et al. 2022c). To overcome this problem, the data were extracted in an annulus rather than a circle. This degraded the signal-to-noise but allowed us to examine the X-ray emission, for which the presence of a strongly absorbed hot X-ray plasma was clearly detected. The high luminosity combined with the high temperature of the X-ray emitting plasma revealed that ζ Tau belongs to the growing class of γ Cas analogs. This γ Cas character was subsequently confirmed thanks to the first four semesters of eROSITA observations (Nazé & Robrade 2023), although the short exposure time (even when combining all semesters) and the presence of optical loading (i.e., contamination of X-ray data by optical and/or UV photons) limited the quality of these data.
γ Cas analogs share unique X-ray characteristics (Smith et al. 2016; Nazé & Motch 2018): high temperatures (kT > 5 keV), high luminosities (log(LBOL/L⊙) of −6.2 to −4, which are in between values for “normal” OB stars and X-ray binaries), short-term “shots”, and the presence of an iron fluorescence line at 6.4 keV. To date, peculiarities have only been found for these stars in the X-ray range. The origin of the γ Cas phenomenon remains a puzzle. Several scenarios have been proposed to explain the presence of such a hot plasma. One of them envisages the X-rays arising from localized magnetic star-disk interactions (Smith et al. 1998). Others rather invoke a major role for the companion to the Be star, with either accretion onto a WD (Hamaguchi et al. 2016), accretion onto a neutron star in the propeller stage (Postnov et al. 2017), or a collision between the wind of a subdwarf companion and the Be disk (Langer et al. 2020). Both observational and theoretical arguments could discard the latter two ideas (Smith et al. 2017; Nazé et al. 2022c; Rauw 2024). However, the non-detection of subdwarf stars in some γ Cas systems, suggesting that the companions are WDs, may provide some support for the accreting WD idea (Gies et al. 2023). Two scenarios thus remain, with or without the (contemporary) involvement of a companion.
To better characterize the high-energy emission of ζ Tau, and gain further insight into the origin of the X-ray emission, we obtained two high-quality XMM-Newton exposures of ζ Tau. They were taken at two very different orbital phases, allowing us to probe the system first when the Be star appears in front of its companion and then in the opposite situation. If the X-rays arise close to the companion and the absorption is due to the Be disk, then a strong modulation of the absorption with orbital phase should be detected – but alternative configurations are possible. The XMM-Newton data will therefore be interpreted considering the previous X-ray observations but also optical spectroscopy and broad-band photometry from TESS. The data are presented in Sec. 2, the observational results are provided in Sec. 3 and discussed in Sec. 4, and Sec. 5 summarizes our conclusions.
2 Data
The XMM-Newton data were acquired in March and October 2023 (ObsID = 0920020301, 0920020401). These epochs correspond to two opposite orbital phases, ϕ = 0.0 and 0.5 (Be star in front and companion in front, respectively, using the ephemeris of Nazé et al. 2022c). The observations used a thick filter to avoid optical contamination from the very bright optical emission of that object (V = 3.03). In addition, the “small window” mode was used to avoid pile-up.
The data reduction was done with the Science Analysis Software (SAS) v21.0.0 and calibration files available in September 2023. First, the pipeline processing was applied to both European Photon Imaging Camera (EPIC) cameras, then a filtering was done on the event files to keep only the best-quality data (PATTERN 0–12 for MOS and 0–4 for pn). Following the inspection of global light curves at energies above 10 keV, no contamination by background proton flares was detected.
Stray light from the Crab Nebula, which lies at 1.1° of ζ Tau, contaminates the field of view (Fig. 1). Fortunately, it does not impact ζ Tau or its close surroundings so that a clean extraction can be done for the target. The source counts were extracted in a circle centered on the Simbad coordinates of ζ Tau and with a radius of 30″. Background regions were chosen on the same central CCD, at a location as nearby as possible from the source and with the largest radius possible (see Fig. 1).
Using these regions and the dedicated SAS reduction tasks, spectra and their response matrices were built, as well as light curves corrected to provide equivalent full-PSF, on-axis count rates. To assess the effect of time binning, light curves were calculated for 10, 100, and 500 s bins in the 0.5–10 keV energy band. In addition, to investigate changes in hardness, light curves were constructed for two energy bands, 0.5–2 keV and 2–10 keV with the 500 s bin. To investigate the presence of “softness dips” (Hamaguchi et al. 2016), three additional energy bands were considered (0.5–1.5, 1.5–4, 4–10 keV) but only with a 1000 s time bin in view of the low number of counts in the soft band. These bands also correspond to three zones with different long-term behavior (see Sec. 3.2). The average count rates in the total band are 0.41 and 1.32 cts s−1 for MOS and pn in the first exposure, respectively, and 0.51 and 1.45 cts s−1 for the same cameras in the second exposure. The counts in 0.5–2 keV represented only about 2% of all recorded counts in the first exposure, but that fraction doubled in the second one.
In support of the XMM-Newton data, we made use of the Chandra and eROSITA data previously published (Nazé et al. 2022c; Nazé & Robrade 2023). In addition, optical amateur data presented in Nazé et al. (2024), and taken close to the time of the X-ray exposures, are also used. Finally, ζ Tau has been observed by the TESS mission, with a 2 min cadence, during Sectors 43 to 45 (in 2021) as well as Sectors 71 and 72 (in 2023). These light curves were downloaded from MAST archives2 and filtered to keep only the corrected points of highest quality (null quality flag and PDCSAP – Pre-search Data Conditioning Simple Aperture Photometry – to eliminate instrumental, long-term trends). Fluxes were converted into magnitudes and the average value was subtracted.
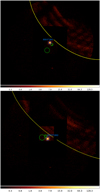 |
Fig. 1 Field of view (15′ radius) of both XMM-Newton exposures (all EPIC cameras combined; March 2023 on top, October 2023 at the bottom). The yellow arcs mark the limit of the stray light contamination, the blue circles correspond to the source extraction regions (30″ radius), and the green circles are the background extraction regions (their size is limited by the “small window” mode: the smaller ones are for MOS cameras, the larger one for the pn camera). |
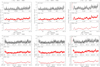 |
Fig. 2 X-ray light curves recorded for ζ Tau with EPIC-MOS1 (left), MOS2 (middle) and pn (right) in the 0.5–10 keV energy band and for three time bins. The data points and their error bars are shown in red for the two longer bins. The first XMM-Newton observation is shown on top and the second one at bottom. |
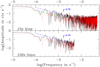 |
Fig. 3 Fourier transform of the EPIC-pn light curves in total band, shown with log-log scaling. The 10 and 100 s binning are used on top and bottom, respectively, and the first and second XMM-Newton observations are represented by the solid black and dotted red lines, respectively. The blue line provides A ∝ f−−0.75 while the green line shows A ∝ f−0.5. |
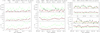 |
Fig. 4 Curves in three energy bands and their ratios. Left and middle: EPIC light curves in the two XMM-Newton observations (March in the left panel, October in the middle panel) in the 0.5–1.5, 1.5–4., and 4–10 keV energy bands with a 1 ks time bin. EPIC-MOS1 data are shown with a solid black line and dots, MOS2 with a dashed red line and crosses, and pn with a dotted green line and triangles. Right: ratios of these count rates for the first (top) and second (bottom) XMM-Newton observations. |
3 Results
3.1 Intra-pointing light curves
Figure 2 shows the X-ray light curves in the total energy band for the three EPIC cameras and both exposures. All three cameras display a similar behavior, with variations well over the expected Poisson noise. In the first XMM-Newton observation, the count rate increases over the whole duration of the exposure. In addition, several short-term flux increases can be discerned: a narrow one at the start of the exposure, followed by approximately three broader ones. In the second observation, we can see the end of such an event at the start of the exposure, followed by a shallow general increase superimposed on several narrow increases (“shots” and shot aggregates) of various amplitudes and durations. Such features are regularly seen in γ Cas analogs (Lopes de Oliveira et al. 2010; Torrejón et al. 2012; Nazé et al. 2017) and can even be considered as typical of this class, as they are not detected in “normal” OB stars (Smith et al. 2016).
A Fourier algorithm (Gosset et al. 2001) was applied to the total band curves for both 10 and 100 s bins, which yields similar results (Fig. 3). No persistent periodic signal is detected although a small (transient) peak appears at a timescale of 3.7 ks (about 1 h) in the first XMM-Newton observation. As in other γ Cas analogs (Lopes de Oliveira et al. 2010; Torrejón et al. 2012; Nazé et al. 2017), a decreasing amplitude as the frequency increases is detected. The trend follows A ∝ f−0.75, which is slightly steeper than the A ∝ f−0.5 found for γ Cas in Lopes de Oliveira et al. (2010) and Smith et al. (2016), but the periodogram is not as precise as in γ Cas so that the exponent is less well constrained and an exponent of −0.5 cannot be excluded. At higher frequencies, Poisson noise comes into play and the upper limit of the curve flattens, so that the two-slope break near 0.01 Hz seen in γ Cas (Lopes de Oliveira et al. 2010) cannot be detected here.
Turning to the hardness ratios, no significant correlation between the count rate in the total band and hardness can be discerned. However, Hamaguchi et al. (2016), Smith & Lopes de Oliveira (2019), and Rauw et al. (2022) reported on the presence of “softness dips” in the light curve of γ Cas; that is, time intervals with a lower fraction of very soft counts in the signal (whatever its overall amplitude). A feature of this type may have been possibly detected at the end of the first XMM-Newton observation, although it was detected only in the pn camera and with a low significance (Fig. 4). We note however that the soft count rate is very low and the noise in the MOS cameras is larger than for the pn.
3.2 TESS
The TESS light curves of ζ Tau are shown on Fig. 5. The amplitude of the variations is rather small, generally below 10 mmag as in other γ Cas analogs (Nazé et al. 2020). However, the light curve shape is not constant as there are short intervals at which oscillations clearly display larger amplitudes. The transition to such changes appears rather abrupt. The periodograms for individual as well as combined sectors has no significant high-frequency signal (10–360 day−1) but display broad multi-frequency peaks at low frequencies (“frequency groups”) as often found in Be stars (Nazé et al. 2020; Labadie-Bartz et al. 2022). These periodograms display similar, but not exactly identical, features. In particular, the amplitude of the signals do considerably vary with the considered sector, as could be expected from the light curve behavior. The structure of the frequency groups also changes from sector to sector. The most common signals are detected near 0.23–0.24 day−1, near 0.95–1.08 day−1, near 1.26–1.32 day−1, and near 2.0–2.5 day−1.
All TESS photometric datasets was gathered as the Hα line strength was declining (i.e. its core absorption was growing, see Sec. 4.1), but there does not seem to be any simultaneous monotonic trend in the TESS data. The fourth eROSITA scan was performed at the start of the 2021 TESS observations, just before the strong oscillation episode. Nothing particular is detected in the optical light curve at the time of these X-ray observations (Fig. 5). The last XMM-Newton observation was taken just before the 2023 TESS data were gathered hence nothing can be concluded regarding the optical behavior at that specific epoch.
The largest amplitude of the oscillations is detected near ϕ = 0. The 2021 and 2023 TESS datasets cover different orbital phase intervals, but there is a small phase overlap near ϕ = 0.9–0.95. When those two datasets are directly compared (Fig. 5), the TESS data show no sign of a recurrent behavior with orbital phase: the zero phase of the strongest oscillations in 2021 thus probably is a coincidence.
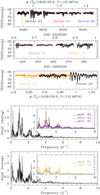 |
Fig. 5 TESS data of ζ Tau. Top: the TESS light curves of ζ Tau in sectors 43–45 (first panel) and 71–72 (second panel), with phase axis on top and Julian Date axis at the bottom. The third panel compares the data overlapping in orbital phase. Bottom: periodograms of the combined (43–45 and 71–72) light curves with insets showing the individual periodograms for each Sector. |
3.3 Spectra
As can be seen in Fig. 6, the spectrum of ζ Tau is dominated by hard X-rays. This emission comes from a very hot plasma, as the intense iron lines at 6.7–7.0 keV testify. However, this emission suffers from a strong absorption that removes most flux below 4 keV. At the lowest energies, the flux decrease stops and a faint soft component starts to appear. It could not be seen in the previous Chandra and eROSITA data due to their low signal-to-noise at these energies.
Comparing the two XMM-Newton exposures reveals that the spectrum remains the same at the lowest and highest energies, but not in between (Fig. 6). It is only between 1.5 and 4 keV that changes are seen. At first sight, this seems to suggest a change in the absorption toward the hottest plasma. To ascertain what exactly happens, the spectra were fitted for E > 0.3 keV, within Xspec v.12.11.1, using solar abundances of Asplund et al. (2009).
The first fitting trial considered a single thermal component (apec) absorbed by the interstellar medium (![Mathematical equation: $\[N_{\mathrm{H}}^{\mathrm{ISM}}\]$](/articles/aa/full_html/2024/08/aa49737-24/aa49737-24-eq1.png) = 2.7 × 1020 cm−, see Nazé et al. 2022c) and some local material. While this fits well the high-energy part, the spectrum at low energies is not at all reproduced. We therefore introduced a second, cooler, component. This was still insufficient, so a third thermal component was added. This improved the situation at low energies although some small features near 1 keV were still not perfectly reproduced, suggesting the need of a fourth thermal component. In addition, a Gaussian was clearly needed to reproduce the iron fluorescence line at 6.4 keV (the line energy was fixed to that value and the line width was set to zero as the line is not resolved by the EPIC instruments). Adding a separate absorption for the warm thermal components resulted in an absorbing column compatible with zero, so it was discarded. Our final model thus consisted in four thermal components, plus one Gaussian and some absorption for the hottest component: phabs(ISM) × [apec1 + apec2 + apec3 + phabs × apec4 + Gaussian].
= 2.7 × 1020 cm−, see Nazé et al. 2022c) and some local material. While this fits well the high-energy part, the spectrum at low energies is not at all reproduced. We therefore introduced a second, cooler, component. This was still insufficient, so a third thermal component was added. This improved the situation at low energies although some small features near 1 keV were still not perfectly reproduced, suggesting the need of a fourth thermal component. In addition, a Gaussian was clearly needed to reproduce the iron fluorescence line at 6.4 keV (the line energy was fixed to that value and the line width was set to zero as the line is not resolved by the EPIC instruments). Adding a separate absorption for the warm thermal components resulted in an absorbing column compatible with zero, so it was discarded. Our final model thus consisted in four thermal components, plus one Gaussian and some absorption for the hottest component: phabs(ISM) × [apec1 + apec2 + apec3 + phabs × apec4 + Gaussian].
While the fitting used all EPIC spectra simultaneously, the two observations were fitted independently. As the first, second, and last best-fit temperatures agreed well, within errors, they were fixed and the fit was re-done with kT1 = 0.085 keV, kT2 = 0.55 keV, and kT4 = 9.10 keV. The resulting parameters are provided in Table 1. A last trial was inspired by the analysis of the XMM-Newton spectra of γ Cas (Smith et al. 2004; Rauw et al. 2022): it considers kT3 = kT4; in other words, only part of the hot component suffers from a (large) local absorption. The temperatures converged to similar values in both observations and thus were fixed (kT1 = 0.085 keV, kT2 = 0.55 keV, and kT3 = kT4 = 9.05 keV). The results of this trial are provided at the bottom of Table 1. We note that most of the hot plasma is strongly absorbed. The normalization factor of apec4 is at least 99.7% of the full normalization of the hot component (apec3 + apec4). Using a formal model of partial covering absorption (i.e. phabs(ISM) × [apec1 + apec2 + pcfabs × apec3 + Gaussian]) with the same temperatures confirms these results: the best-fit covering fraction is 1, with an error of 0.001.
Overall, both model choices provide fits of similar quality, with the parameters agreeing well. Comparing the two observations, ζ Tau appeared only slightly (4%) brighter in the first XMM-Newton observation. One major change appears obvious, however: the near halving of the local absorbing column toward the hot component in the second observation (see also Fig. 6), which results in a large (+150%) variation in the flux in the soft band.
A specific feature in these X-ray spectra is the presence of the iron fluorescence line at 6.4 keV, a typical characteristic of the γ Cas phenomenon. Examining the fitting, we find that there appears to be a shift of the feature toward lower energies compared to the models. It is particularly detectable for the pn data of the second XMM-Newton observation (Fig. 7), but a slight shift may also exist for MOS2 and the other pn spectra. This probably comes from imperfections in the charge transfer efficiency calibration. To solve this issue, the XMM-Newton EPIC-pn team recommended that we allow for slight adjustments in the response matrices using the “gain fit” command under xspec. However, this solution remains approximate and therefore should be used with caution. In particular, the fitting should be restricted to a narrower energy band than the full energy range (we use 5.0–10.0 keV) and with an offset of the gain kept within ± 10 eV. Three models were used. The first one was a simplified version of the above model; that is, apec + gaussian with the temperature fixed to 9.1 keV and the line center and width fixed to 6.4 and 0 keV, respectively. The second and third models considered a continuum emission combined with three Gaussians of null intrinsic width centered on 6.4, 6.7, and 6.97 keV, as was done for γ Cas (Rauw et al. 2022). The continuum was either a bremsstrahlung with temperature allowed to vary (second model) or a power law (third model). The EPIC spectra were fitted all simultaneously or individually, to assess the errors. All three modeling methods yielded similar results. The gain adjustment, used for MOS2 and pn spectra, always resulted in a lower strength for the fluorescence line: the average equivalent width (EW) of the fluorescence line decreased from 72±18 to 59±11 eV for the first XMM-Newton observation after response adjustment and from 89±14 to 65±11 eV for the second XMM-Newton observation. In any case, the EWs appear similar in both observations as well as similar to or slightly higher than the fluorescence values recorded for γ Cas itself (Rauw et al. 2022).
Finally, spectra were extracted before and during the shallow “softness dip” detected at the end of the first XMM-Newton observation (i.e. HJD < or > 2460024.1, see Sec. 3.1). We performed a spectral fitting similar as for the full observation. We allowed however the absorbing column toward the warm plasma components to vary (phabs(ISM) × [phabs × (apec1 + apec2 + apec3) + phabs × apec4 + Gaussian], with kT1 = 0.085 keV, kT2 = 0.55 keV, and kT4 = 9.10 keV). This yielded inconclusive results, since parameters agreed within errors. A trial was then made to fit both subexposure spectra together, letting absorptions vary but allowing only for a global scaling of the normalization factors between the two observations. The resulting 1-σ confidence intervals for the absorbing columns toward the warm plasma components are 0 − 0.10 and 0.09–0.24 × 1022 cm−2 before and during the dip, respectively. This shallow softness dip thus appears consistent with a marginal increase in absorption, but it is certainly not a drastic change.
To complement the XMM-Newton results, the Chandra (Nazé et al. 2022c) and eROSITA (Nazé & Robrade 2023) spectra were fitted again. This time, we fixed the hot temperature to the same value as for XMM-Newton and did not consider warm plasma components since they cannot be detected in these lower quality spectra (Table 2). The fitting of the Chandra observation indicated a large absorbing column, which agreed with that of the first XMM-Newton exposure, within errors. The absorption found for the average eROSITA spectrum appears intermediate, at 2σ of each of the XMM-Newton values. For eROSITA observations, we further investigated the spectral shape in each of the four survey semesters. These individual exposures are short (200 s) but each dataset consists of several scans taken over ~1 d (i.e. at the same orbital phase). They thus enabled us to derive further constraints on orbital variations (if any). As in Nazé & Robrade (2023), the fitting to eROSITA data was performed with a power law to constrain the optical loading contribution (dominating below 1 keV) in addition to the absorbed thermal component. We considered the four individual spectra together, allowing only for local absorptions and normalization factors to vary freely while forcing other parameters to keep the same values in the four individual fits. This allowed us to better constrain the optical loading, which should remain constant (within errors) between exposures. Results are provided in Table 2. It may be noted that similar results are achieved (1) if the optical loading power law has parameters fixed to those found for the best-fit to the average eROSITA spectrum and (2) if the spectral bins below 1 keV are ignored and the remaining spectral bins are fitted with a simple thermal component. In the XMM-Newton datasets, the largest variations appear in the 2–4 keV energy band. This can be confirmed by eROSITA observations, as the survey data analysis provides equivalent on-axis, full-PSF count rates in the 2–5 keV and 5–8 keV energy bands (Table 2). These count rates confirm the behavior observed for XMM-Newton, with similar values, within errors, at the highest energies and larger variations in the medium energy range. This is directly reflected in the spectral fitting by larger absorbing columns when the 2–5 keV count rates are lower.
ζ Tau (type B1IVe) is an early B-type star. The presence of the warm plasma components in its X-ray spectrum could simply reflect the typical X-ray emission of massive stars. To test this idea, we evaluated the unabsorbed (i.e. corrected for interstellar absorption) flux of these components in the 0.5–10 keV band. In our first model, this intrinsic flux would correspond to the sum of the fluxes of the first three apec components, even if the last one has a rather high temperature for such intrinsic X-rays. This flux amounts to 7.3 and 8 × 10⁻¹⁴ erg cm−2 s−1 for the first and second XMM-Newton observations, respectively. For the second model, the intrinsic flux would correspond to the sum of the fluxes of the first two apec components; that is, 2.8 and 2.5 × 10⁻¹⁴ erg cm−2 s−1 for the first and second XMM-Newton observations, respectively. Given the distance and the bolometric luminosity of ζ Tau (136 pc and log(LBOL/L⊙) = 3.75, see Nazé et al. 2022c and references therein3), these fluxes convert into X-ray luminosities of 0.6–1.8×1029 erg s−1; hence, a luminosity ratio log(LX/LBOL) between −8.6 and −8.1. Such values seem reasonable for this type of star. They appear at the faint end of what was found for Be stars in X-rays (Nazé & Motch 2018; Nazé & Robrade 2023). The faint and soft X-ray emission is therefore most probably intrinsic to the Be star itself. In comparison, we note that the full X-ray luminosity of ζ Tau, after correcting for interstellar absorption, is much larger, around 4 × 1031 erg s−1.
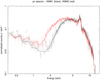 |
Fig. 6 X-ray spectra recorded for ζ Tau by the EPIC-pn camera in the first (black) and second (red) XMM-Newton observations, along with their best-fit models (top of Table 1). |
Results of the spectral fitting of XMM-Newton spectra.
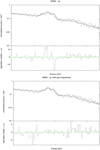 |
Fig. 7 Zoom on the 5–10 keV interval, showing the iron complex recorded by EPIC-pn in the second XMM-Newton observation, with the best-fit model superimposed. The top panel corresponds to the normal fit, while the bottom one makes uses of the response adjustment. |
4 Discussion
4.1 The variations in ζ Tau
The X-ray observations indicate the presence of both warm and hot plasma, with the latter component suffering from a very strong local absorption. This strong absorption appears unrelated to the “softness absorption dips” apparently occurring randomly in time, detected for γ Cas (Hamaguchi et al. 2016; Rauw et al. 2022) and possibly toward the end of the first XMM-Newton observation of ζ Tau. Such dips affect the very soft energy range (below 1.5 keV) and correspond to increased absorption (up to 1022 cm−2) toward the warm+hot plasma components. In ζ Tau, the main absorption is large (at least 1023 cm−2), impacts only the hottest plasma component, and affects the flux in the medium energy range (1.5–4 keV, see Fig. 6). The strong absorption therefore represents a different, additional, feature from the softness dips. In this context, it is important to note that this strong absorption is detected in all X-ray observations, taken by independent facilities (Chandra, eROSITA, XMM-Newton) at different epochs; hence, it is not a transient feature observed only once.
An additional characteristic of the strong absorption is its variability, with a doubling of the absorbing column between the two XMM-Newton exposures. This is found whatever the spectral model choice, and hence is a very robust result. The origin of this variability can be discussed. The first thing that comes to mind is of course an orbital effect. The first XMM-Newton observation was taken close to conjunction, when the Be star was in front of its companion (ϕ = 0.02), while the second one, with a lower absorbing column, was taken at the opposite phase, when the companion was in front of the Be star (ϕ = 0.50, Fig. 8). One would off-hand think that the X-ray absorption increases as the Be star and its disk enter the line of sight toward an X-ray emitting region attached to the companion. We note in this context that the fast rotation of Be stars is thought to originate from a mass-transfer event, suggesting that the orbital and rotational axes should be nearly coincident. It is worth considering also that a Be disk inclined with respect to the orbit would lead to regular outbursts at companion’s crossing in the case of accretion-powered X-rays (as seen in high-mass X-ray binaries), but none are seen for ζ Tau or other γ Cas analogs. The orbital plane of the ζ Tau binary can thus be considered to be similar to that of the Be disk.
Although the Chandra data were gathered at a phase (ϕ = 0.63) just after that of the second XMM-Newton observation, with the companion in front, they present an absorbing column close to that of the first XMM-Newton observation, when the Be star was in front. In addition, the four eROSITA datasets were taken at various phases: before the first XMM-Newton exposure for the first and fourth eROSITA observations (ϕ = 0.84, 0.93), in between the second XMM-Newton and single Chandra exposures for the third eROSITA one (ϕ = 0.56), and at quadrature (ϕ = 0.23, between the two XMM-Newton exposures) for the second eROSITA one (see top panel of Fig. 8). However, their absorptions can hardly be reconciled with an orbital effect. Indeed, the first and third eROSITA spectra (ϕ = 0.84, 0.56) share similar absorptions to those of the Chandra and first XMM-Newton spectra (ϕ = 0.63, 0.02) despite all four observations having very different phases. Much larger absorptions are found in the second and fourth eROSITA datasets (ϕ = 0.23, 0.93) although the latter one has a phase close to that of the first eROSITA scan (ϕ = 0.84). The middle right panel of Fig. 8 summarizes the variations in the absorbing column with respect to phase, graphically demonstrating the absence of the link that has just been described. At similar phases, very different absorptions can be observed. Therefore, a coherent, phase-locked absorption effect seems unlikely.
Another possible explanation for the absorption variability is a change in the disk. With this aim we examine in the top panel of Fig. 9 the evolution of some common disk diagnostics. On the one hand, there does not seem to be drastic photometric changes between the times of the X-ray exposures, although the AAVSO4 B, V magnitudes (reported by a single contributor, the University of Illinois) are quite noisy, and hence could hide small-to-moderate (<0.2 mag) variations. On the other hand, the Hα line is continuously varying. Nazé et al. (2022c) showed that the recent Hα changes mostly consists of a varying central absorption, without much V/R asymmetry and without a specific recurrence timescale. In the last two optical observing seasons (2022–23 and 2023–24), the triple-or multiple-peaked profile returned when the central absorption was minimum, as did some slight V/R asymmetry at some epochs (Nazé et al. 2024). However, the situation still appears far from the cyclic changes with strong asymmetries observed in 1997–2008 (Štefl et al. 2009). The EWs of the Hα line, measured from −600 km s−1 to +600 km s−1 on the BeSS amateur spectra closest to the X-ray observations5, yield a range of values: −10.9, −9.1, −13.4, −15.8, −13.4, −17.0, and −14.4 Å for the four eROSITA observations, the single Chandra exposure, and the two XMM-Newton observations, respectively.
More precisely, when examining the line profiles (see bottom panel of Fig. 9), the wings of the Hα line always remain similar, but both the asymetry and central absorption depth differ. At the epoch of the second XMM-Newton and third eROSITA observations, the violet peak appears slightly dominant, while the red one is dominant for the first XMM-Newton exposure and Chandra dataset. The profile remained nearly symmetric at the time of the other eROSITA observations. Again, there is no obvious link with the X-ray absorption changes. In parallel, the first two eROSITA observations were taken when the central absorption in Hα was very strong. The third eROSITA, single Chandra, and second XMM-Newton observations were acquired when that central absorption presented a medium depth, while the central absorption displayed small depth values during the last eROSITA and first XMM-Newton observations. Other lines (such as Hβ, He I λ6678 Å, Si II λ5321,5363 Å, N II λ6242–8 Å, and O I λ7771–5 Å, using amateur echelle spectra) confirm these trends although their variations are much smaller (due to their different formation regions).
In contrast, the X-ray absorbing column is largest for the second and fourth eROSITA datasets, which lie at opposite extremes of the Hα central absorption strength (minimum below the continuum level or at twice the continuum value, respectively, see Fig. 9). Also, the X-ray absorbing column appears the lowest in the second XMM-Newton observation while a medium depth is then recorded for Hα. In fact, for the more precise XMM-Newton exposures, the smallest central absorption depth in Hα is detected in the first XMM-Newton exposure, when the X-ray spectra presented the largest(!) absorbing column. Again, no obvious link between the two absorptions can be seen (see bottom panels of Fig. 8). In recent years, the peak separations in the Hα line profiles appear anticorrelated with the strengths of the central absorption (i.e. deeper central absorptions are generally associated with more separated peaks – see Nazé et al. 2024). The optical spectra taken at the phases closest to the X-ray observations follow this trend (Fig. 8). As for the central absorption depth, there is no clear relationship between peak separation and X-ray absorption (Fig. 8). Therefore, (1) there is no drastic global change in the Be disk (i.e. build-up or disappearance), as traced by the B, V magnitudes and the optical spectra, between the different epochs of X-ray observations and (2) the detailed Hα profile properties (depth of the central absorption, symmetry, peak separation, and EW) appear uncorrelated with the X-ray absorbing column values. A direct link between the Be disk properties and the X-ray absorption thus appears unlikely.
In ζ Tau, the X-ray absorption changes therefore seem unrelated to the orbital phase or to the disk variations detected in the Hα line. This is not unexpected for γ Cas objects. Indeed, no evidence of a phase-locked behavior was found in the (only) two previously thoroughly monitored cases, γ Cas (Smith et al. 2012b; Rauw et al. 2022) and π Aqr (Nazé et al. 2019). In addition, the link between the X-ray emission and the Hα properties appears far from obvious in previous studies, with some objects keeping their γ Cas peculiarities while displaying very little Hα emission (Nazé et al. 2022b). This implies that the line of sight toward the hot plasma is different from the line of sight toward the companion (and its local environment) or from that in the disk (as traced by Hα). In this context, it is also useful to note that the EW of the fluorescence Fe Kα X-ray line remains rather stable in the datasets of both γ Cas (Rauw et al. 2022) and ζ Tau (this work).
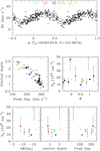 |
Fig. 8 Comparison of optical and X-ray characteristics. Top panel: radial velocities of the Be star in ζ Tau, measured from the Hα line using the double Gaussian method (filled triangles from Nazé et al. 2024 and empty triangles from the appendix of Nazé et al. 2022c) and phased with the ephemeris of Nazé et al. (2022c). Vertical lines show when X-ray observations were taken. Orbital phases 0 and 0.5 correspond to conjunctions with the Be star and its companion in front, respectively, while phases 0.25 and 0.75 correspond to quadratures. Bottom panels: comparison between the X-ray absorbing column and various diagnostics: orbital phase as well as EW, central absorption depth, and peak separation of the Hα line. The colors are the same as in the top panel. |
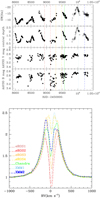 |
Fig. 9 Optical behavior of ζ Tau. Top panels: evolution with time of EW and central depth of the Hα line from amateur spectra (BeSS database – black dots from Nazé et al. 2022c, circles from Nazé et al. 2024), as well as B, V magnitudes of ζ Tau as reported in the AAVSO database. Bottom panel: Hα line profiles at times closest to those of the X-ray observations. |
4.2 ζ Tau in context: The star-disk interaction scenario
With its high temperature, high luminosity, strong iron fluorescence line, and short-term variations, ζ Tau clearly displays all characteristics of the γ Cas analogs. Its particularity is the presence of a strong and varying absorbing column toward the emission by the hottest plasma. To underline this uniqueness of ζ Tau, one may compare with the detailed spectral fitting of γ Cas. Rauw et al. (2022) used a combination of absorbed warm and hot plasma components, as above. They only found large absorptions toward the hottest component, up to 2 × 1023 cm−2, if such absorptions applied to a small fraction (<20%) of the hot component emission. When that fraction was larger, notably when it reaches over 90% as found in ζ Tau (see Sec. 3.2), the column appeared much more modest (up to 1.4× 1022 cm−2). The X-ray absorption of ζ Tau therefore truly appears exceptionally high.
However, it may be noted that, among the γ Cas analogs with known inclinations, ζ Tau is also the only one with the Be disk seen edge-on. Most probably, high absorption and high inclination are related. In the context of the magnetic star-disk interaction scenario, hard X-rays arise from regions close to the star and the disk. This implies that they may suffer from absorption due to the Be disk. To assess whether this is in line with observations, we calculated the absorbing column due to the Be disk material along the line of sight. To this aim we considered the usual density dependencies for Be disks:
![Mathematical equation: $\[n(r, Z)=n_0(R / r)^\alpha \mathrm{e}^{-Z^2 /\left(2 H^2\right)}\]$](/articles/aa/full_html/2024/08/aa49737-24/aa49737-24-eq6.png) with r the distance to the star’s center in the equatorial plane, Z the distance above the equatorial plane, and the scale height H = H0(r/R*)(3–p)/2.
with r the distance to the star’s center in the equatorial plane, Z the distance above the equatorial plane, and the scale height H = H0(r/R*)(3–p)/2.
Several sets of parameters were considered for these calculations, inspired by Rauw (2024). The equatorial radius of the star was set to 7.7 R⊙ and the density at the inner edge of disk 1.3 × 10⁻¹⁰ g cm−3 (corresponding to n0 = 5.8 × 1013 cm−3 since the absorbing column NH concerns only hydrogen). The latter value is an average based on published densities (Gies et al. 2007; Carciofi et al. 2009; Touhami et al. 2011), but values of n0 = 1.5 and 2.6 × 1013 cm−3 were also tried. Indeed, it may be noted that the Hα line has recovered from its 2013 minimum. The maximum amplitude is about 2.5 times the normalized continuum and the EW was around −15 Å at the time of the Chandra and XMM-Newton observations (Fig. 9). This can also be compared to values of about 3 times the continuum and around −20 Å during the well-studied V/R cycles of 1997–2008 (Štefl et al. 2009; Pollmann 2017). Therefore, a somewhat lower density may be expected. The exponents α and p were assumed to be 3 and 0 by default, respectively, but values of 3.5 and 0.25 were also considered. Inclinations of 75, 80, 85, and 90° were examined (with 85° the default value). The disk was assumed to extend either to the Roche lobe radius (149 R⊙) or to the 3:1 truncation radius (118 R⊙). The emitting point, at which the integration starts, was set at a distance Rin from the star’s center and at a distance z above the equatorial plane. Values for Rin were R* (at the photosphere, default case) or 2R* and extreme z values are ±R*. The longitude of the emitting point was allowed to vary between θ = 0° (i.e. emission arising on the meridian facing the observer) and 90° (i.e. perpendicular to the meridian). The initial scale height is given by H0 = cs(R*)R*/VKep, with VKep the Kepler rotational velocity at the photosphere ![Mathematical equation: $\[\left(V_{\mathrm{Kep}}=\sqrt{G M_* / R_*}\right)\]$](/articles/aa/full_html/2024/08/aa49737-24/aa49737-24-eq7.png) and cS the sound speed; that is,
and cS the sound speed; that is, ![Mathematical equation: $\[c_{\mathrm{S}}=\sqrt{\gamma k T /\left(\mu m_{\mathrm{H}}\right)}\]$](/articles/aa/full_html/2024/08/aa49737-24/aa49737-24-eq8.png) . Depending on the choice of γ (1 if isothermal, 5/3 if adiabatic) and temperature (2/3, 0.8, or 1.0 times the effective temperature Teff of 19 300 K), various H0 values are found; we used 0.272, 0.248, and 0.304 R⊙. Finally, the parameters of Carciofi et al. (2009) were considered: Rout=130 R⊙, Rin = R*, n0 = 2.6 × 1013 cm−3, H0 = 0.230 R⊙ (from γ = 1 and T = 18 000 K), i = 85°, α = 3.5 and p = 0.
. Depending on the choice of γ (1 if isothermal, 5/3 if adiabatic) and temperature (2/3, 0.8, or 1.0 times the effective temperature Teff of 19 300 K), various H0 values are found; we used 0.272, 0.248, and 0.304 R⊙. Finally, the parameters of Carciofi et al. (2009) were considered: Rout=130 R⊙, Rin = R*, n0 = 2.6 × 1013 cm−3, H0 = 0.230 R⊙ (from γ = 1 and T = 18 000 K), i = 85°, α = 3.5 and p = 0.
Figure 10 graphically shows the predicted columns. As was expected, the columns are larger if the emitting point is closer to the equatorial plane and “below” the disk (seen from the observer’s point of view, corresponding to z < 0). The “above” and “below” difference is of course larger for lower inclinations. Longitude has only a small impact on the predicted column, and changing the outer radius in a reasonable range has no significant consequence. Enlarging the initial radius Rin decreases the maximum, but has less impact if emission occurs outside of the equatorial plane. Absorptions for such emissions outside the plane are much more sensitive to the density exponent α. Finally, modifying the initial density n0 produces a simple global scaling of the derived absorbing column. Overall, a deeply embedded emitting region – in other words, near the photosphere and on the equatorial plane – would suffer from very large (more than one dex!) absorptions compared to those derived from the X-ray fitting (NH = 1–5 × 1023 cm−2, see Tables 1 and 2). However, the derived absorbing columns appear similar to the observed ones for moderate elevations above the equatorial plane. The observed columns are thus not incompatible with absorption by the Be disk.
Finally, it may be noted that the absorbing column toward equatorial emission remains large for putative ζ Tau-like systems with low inclinations: 0.5–2 × 1024 cm−2 for i = 20° vs. 0.4–1.6 × 1025 cm−2 for i = 90°, depending on the choice of disk parameters (see above). As absorbing columns toward other known γ Cas analogs are lower, this suggests that either X-ray emissions always arise outside of the equatorial plane of the Be disk, or that the Be disk model is inadequate in regions very close to the star. Also, the lack of correlations with spectroscopic features linked to the Be disk remains puzzling. Unfortunately, no precise long-term X-ray and visible photometry is available to make a comparison as for γ Cas (Motch et al. 2015; Rauw et al. 2022). Clearly, detailed MHD modeling of this scenario would be needed to clarify the emission processes.
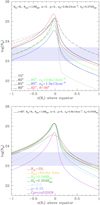 |
Fig. 10 Evolution of the predicted absorbing column from disk material as a function of position above the equatorial plane z and various parameters (the baseline parameters are noted in black and the thick black line provides the associated column; θ = 0° everywhere unless otherwise stated). The observed range of columns is shown by the shaded light lavender area. |
4.3 ζ Tau in context: The accreting white dwarf scenario
White dwarfs have been proposed as the sources of the X-ray emission of γ Cas analogs (Hamaguchi et al. 2016; Gies et al. 2023). In this subsection, we take a look at their properties and compare them to those recorded for ζ Tau. Up to now, only a few cases of WDs paired with Be stars have been reported in literature and their X-ray emissions are very bright and supersoft (Kahabka et al. 2006; Orio et al. 2010; Li et al. 2012; Sturm et al. 2012; Cracco et al. 2018; Coe et al. 2020; Kennea et al. 2021), in stark contrast with the high-energy properties of ζ Tau and other γ Cas analogs.
Other WD systems, in particular the cataclysmic variables (CVs), may appear hard at X-ray wavelengths, though (for a thorough review, see Mukai 2017). In these short-period (<2 days) binaries, mass is transferred from a late-type star to the WD through the L1 Lagrangian point. The material can then form an accretion disk (for non-magnetic cases, such as dwarf novae), fall directly on the WD surface (for the highly magnetic cases called polars), or fill a truncated disk and then fall into the WD following the magnetic field lines (for intermediate polars, IPs). Symbiotic systems may also emit hard X-rays but the configuration is different: the companion of the WD is a giant star, typical orbital periods are longer and the accretion is fueled by winds (although disks have been detected in some cases).
Unfortunately, no identified accreting WD system displays a geometry close to that expected for γ Cas analogs in general and ζ Tau in particular. In addition to its long orbital period, the decretion disk, possibly truncated at the 3:1 resonance (118 R⊙ for ζ Tau, see above), lies well inside the Roche lobe of the Be star. The flow of matter entering the WD Roche lobe would then be concentrated along the plane of the decretion disk with velocities dominated by the Keplerian tangential component. Such an accretion geometry and velocity pattern contrast with those in CVs and symbiotic stars. In CVs, the mass donor, companion to the WD, fills its Roche lobe and matter enters the WD Roche lobe through L1 while most symbiotic stars are fed by winds flowing from the giant companion star. A comparison nevertheless remains interesting, to assess the plausibility of the accreting WD scenario6.
Regarding temperatures, there are usually two types of spectral components in X-rays from accreting WDs, a soft one (arising at or near the WD surface, at tens of eV) and a hot one arising in the accreting flow, with values well above 5 keV and typically of several tens of keV. Because of the latter, an intense iron complex naturally arises in the X-ray spectrum. Since cooler material is present, such as the WD surface, a fluorescence line is also detected for these systems. Comparing the properties of the lines in the iron complex (fluorescent Fe Kα, Fe XXV, Fe XXVI), ζ Tau appears to lie among accreting WDs, but between IPs and quiescent dwarf novae (Xu et al. 2016).
Regarding variability, accreting WDs display several types, each with different characteristics. Over the long term, there are of course nova events, recurrent or not, resulting in X-ray outbursts. No outburst has been detected for γ Cas analogs up to now, however. Over the short term, there is also an aperiodic variability called “flickering”. In both non-magnetic CVs (dwarf novae, Balman 2019) and magnetic CVs (IPs, Revnivtsev et al. 2011), the power spectra of the X-ray light curves first follow P ∝ f−1 then P ∝ f−2 with a break near (a few) mHz for non-magnetic cases or (a few) 10 mHz for magnetic cases. This dual slope is interpreted as reflecting density fluctuations in the outer or inner disk, respectively. These fluctuations are thought to be linked to variations in the accreted mass flow (Balman 2020). When there is no disk, as in polars, the fluctuating accretion directly affects the X-ray emission. For example, in the polar AM Her, after taking out the orbital modulation, the X-ray light curve displays variations following P ∝ f−1.34 (Beardmore & Osborne 1997, see also Fig. 4 of Christian 2000). In the extremely hard ζ Tau, Fig. 3 above provides the periodogram amplitude – the squared root of power – so that P = A2 ∝ f−1.5 with no clear break between 1 and 10 mHz. Due to noise (see Sec. 3.1 above), the exponent is not well defined, however, and P = A2 ∝ f−1 could also fit. A better characterization was done for the brighter γ Cas, revealing P ∝ f−1.04 at low frequencies and a break near 5 mHz followed by a steeper trend P ∝ f−1.44 (Lopes de Oliveira et al. 2010). Overall, the frequency behavior thus appears quite similar in all these sources. One must remain careful, however, as this does not necessarily point toward the same underlying physical process being at work. In this context, a comparison could also be made on the properties of X-ray “shots” (or quasi-flares, a wording used by Smith et al. 2016). Such “shots” were found to be not only ubiquitous but also gray (i.e. spectral properties were similar whatever the recorded amplitude) for the two γ Cas cases with sufficient signal-to-noise to study them in detail; that is, γ Cas itself and HD 110432 (Smith et al. 1998, 2012a). In contrast, only a few accreting WDs are found to display a strong flaring behavior. It is interpreted as being due to highly inhomogeneous (“blobby”) accretion and it usually occurs during bright and soft X-ray-dominated states (e.g. the soft polars V1309 Ori, Schwarz et al. 2005, AI Tri, Traulsen et al. 2010, and QS Tel, Traulsen et al. 2011). A last case displaying “shots” is AE Aqr, but it corresponds to a propeller stage, not a typical accreting WD case (Itoh et al. 2006). The light curves of these systems exhibit very different color temperatures during flares and in the background flux (Beardmore & Osborne 1997; Schwarz et al. 2005 – see also discussion in Smith et al. 2016).
It is also usual to find in the light curves of CVs a modulation with either the WD spin or the orbital period, but no such variations have been detected for γ Cas analogs up to now (Smith et al. 2016). Regarding the spin signal, however, it remains to be examined what the expected WD spin would be in the case of γ Cas analogs as the known γ Cas binaries display much longer orbital periods than CVs. In fact, this will sensitively depend on the accretion parameters. The starting point may be a slow spin. Indeed, isolated WDs have a mean rotation period of 35 h with a standard deviation of 28 h (Hermes et al. 2017), and the mass transfer from the WD progenitor onto the (future) Be star may have led to a further spin-down of the WD remnant. However, if accretion onto the WD occurs, this will rapidly spin it up, which is why we now examine this process. This requires one to consider whether an accretion disk is formed. To the first order, the conditions to form such an accretion disk do not depend on the nature of the compact object. Several 3D smooth particle hydrodynamics (SPH) models have studied such conditions for compact companions in the framework of Be/X-ray binaries. In most cases an accretion disk can indeed be formed around the neutron star (Okazaki et al. 2013; Hayasaki et al. 2004), although Martin et al. (2014) do not find evidence of a disk in their simulations. Observational evidence such as the detection of a soft excess probably due to the X-ray heated disk remains ambiguous (Hickox et al. 2004). However, the spin-up witnessed during outburst and spin-down in quiescence are best explained by the coupling between the disk and the magnetosphere (Ghosh & Lamb 1979). To adapt to the case of WDs, which are larger than neutron stars, one needs to calculate the circularisation radius Rcirc. In order for an accretion disk to form, this radius must exceed the WD radius Rwd and the effective size of its magnetosphere RM. Frank et al. (2002) proposed as a condition for disk formation Rcirc ≥ 0.37 RM, with Rcirc ≥ RWD and Rcirc = J2/GMX (where J is the initial specific angular momentum of the accreted material). The magnetospheric radius is ![Mathematical equation: $\[R_{\mathrm{M}}=5.5 \times 10^8 ~M_{\mathrm{WD}} ~R_9^{-2 / 7} ~L_{33}^{-2 / 7} ~\mu_{30}^{4 / 7} \mathrm{~cm}\]$](/articles/aa/full_html/2024/08/aa49737-24/aa49737-24-eq9.png) (Frank et al. 2002), where R9 is the WD radius in units of 109 cm, L33 the X-ray luminosity in units of 1033 erg s−1 and μ30 the WD magnetic moment in units of 1030 G cm3. The angular momentum J cannot be accurately calculated without resorting to hydrodynamical modeling. The SPH modelings of 4U 0115+63 by Hayasaki et al. (2004) and of A 0535+262 by Okazaki et al. (2013) in coplanar configurations suggest Rcirc ~ 0.01 × a where a is the semi-major axis of the orbit. If similar values of Rcirc apply to ζ Tau, for which a ~ 252 R⊙, only WDs with very high magnetic fields (like those seen in polars, see e.g. Ferrario et al. 2015) could prevent the formation of an accretion disk. One can thus reasonably expect spin-up because of this disk. Assuming that ΩWD ≪ ΩMAX where ΩMAX is the breakup angular velocity, the angular velocity increase is given by
(Frank et al. 2002), where R9 is the WD radius in units of 109 cm, L33 the X-ray luminosity in units of 1033 erg s−1 and μ30 the WD magnetic moment in units of 1030 G cm3. The angular momentum J cannot be accurately calculated without resorting to hydrodynamical modeling. The SPH modelings of 4U 0115+63 by Hayasaki et al. (2004) and of A 0535+262 by Okazaki et al. (2013) in coplanar configurations suggest Rcirc ~ 0.01 × a where a is the semi-major axis of the orbit. If similar values of Rcirc apply to ζ Tau, for which a ~ 252 R⊙, only WDs with very high magnetic fields (like those seen in polars, see e.g. Ferrario et al. 2015) could prevent the formation of an accretion disk. One can thus reasonably expect spin-up because of this disk. Assuming that ΩWD ≪ ΩMAX where ΩMAX is the breakup angular velocity, the angular velocity increase is given by ![Mathematical equation: $\[\dot{\Omega}=I^{-1} ~\dot{M}\left(G M_{\mathrm{WD}} R\right)^{1 / 2}\]$](/articles/aa/full_html/2024/08/aa49737-24/aa49737-24-eq10.png) , with I the WD moment of inertia and R the WD radius if accretion occurs through a disk extending down to the surface or the magnetospheric radius if the accretion disk is truncated by the WD magnetic field. In the slow rotator case, the spin-up rate can be written as
, with I the WD moment of inertia and R the WD radius if accretion occurs through a disk extending down to the surface or the magnetospheric radius if the accretion disk is truncated by the WD magnetic field. In the slow rotator case, the spin-up rate can be written as
![Mathematical equation: $\[\dot{f}_{\text {disk}} \simeq 3.64 \times 10^{-18} ~I_{50} ~\dot{M}_{10}~\left(R_9 ~M_{\mathrm{WD}}\right)^{1 / 2} \mathrm{~Hz} \mathrm{~s}^{-1}\]$](/articles/aa/full_html/2024/08/aa49737-24/aa49737-24-eq11.png)
for disk accretion and
![Mathematical equation: $\[\dot{f}_{\text {mag}} \simeq 1.96 \times 10^{-18} ~I_{50} ~\dot{M}_{10}^{6 / 7} ~M_{\mathrm{WD}}^{3 / 7} \mu_{30}^{2 / 7} \mathrm{~Hz} \mathrm{~s}^{-1}\]$](/articles/aa/full_html/2024/08/aa49737-24/aa49737-24-eq12.png)
for magnetic accretion (Frank et al. 2002). I50 is the WD moment of inertia in units of 1050 g cm−2 (I50 ≈ 1.0), and ![Mathematical equation: $\[\dot{M}_{10}\]$](/articles/aa/full_html/2024/08/aa49737-24/aa49737-24-eq13.png) the mass accretion rate in units of 10−10 M⊙ yr−1. Starting from the extreme case of a non-rotating WD, disk accretion yields
the mass accretion rate in units of 10−10 M⊙ yr−1. Starting from the extreme case of a non-rotating WD, disk accretion yields ![Mathematical equation: $\[P_{\text {spin }}(\mathrm{s}) \simeq 8700~(\mathrm{t} / 1 ~\mathrm{Myr})^{-1} ~\dot{M}_{10}^{-1}\]$](/articles/aa/full_html/2024/08/aa49737-24/aa49737-24-eq14.png) while
while ![Mathematical equation: $\[P_{\text {spin }}(\mathrm{s}) \simeq 2200~(\mathrm{t} / 1 ~\mathrm{Myr})^{-1} ~\dot{M}_{10}^{-6 / 7}\]$](/articles/aa/full_html/2024/08/aa49737-24/aa49737-24-eq15.png) for accretion linked to a magnetically truncated disk with B ~ 106 G, typical of IPs (Ferrario et al. 2015). Therefore, for mass accretion rates of the order of 10−9 M⊙ yr−1, typical of high-luminosity IPs (de Martino et al. 2020), X-ray pulsations with periods similar to those of IPs in equilibrium (Pspin ~ 300–3000 s, de Martino et al. 2020) should already be detectable for ζ Tau (and more generally for γ Cas analogs) after only one Myr of activity. As no such stable X-ray period attributable to WD spins has been observed in γ Cas analogs, this configuration can probably be discarded. In the case of disk accretion, high accretion rates (hence high spin-up rates) are also possible: observations of dwarf novae in outburst or nova-like objects could imply accretion rates of up to a few 10−8 M⊙ yr−1 due to the low hard X-ray efficiency of the boundary layer (Balman 2020). However, the WD rotation usually is undetectable for such systems in X-rays (Balman 2020) so that this configuration cannot be a priori excluded for γ Cas systems.
for accretion linked to a magnetically truncated disk with B ~ 106 G, typical of IPs (Ferrario et al. 2015). Therefore, for mass accretion rates of the order of 10−9 M⊙ yr−1, typical of high-luminosity IPs (de Martino et al. 2020), X-ray pulsations with periods similar to those of IPs in equilibrium (Pspin ~ 300–3000 s, de Martino et al. 2020) should already be detectable for ζ Tau (and more generally for γ Cas analogs) after only one Myr of activity. As no such stable X-ray period attributable to WD spins has been observed in γ Cas analogs, this configuration can probably be discarded. In the case of disk accretion, high accretion rates (hence high spin-up rates) are also possible: observations of dwarf novae in outburst or nova-like objects could imply accretion rates of up to a few 10−8 M⊙ yr−1 due to the low hard X-ray efficiency of the boundary layer (Balman 2020). However, the WD rotation usually is undetectable for such systems in X-rays (Balman 2020) so that this configuration cannot be a priori excluded for γ Cas systems.
A last parameter needs to be examined: absorption. In the context of X-rays born close to the WD companion of the Be star, there are two possible sources of absorption. One is due to the decretion disk of the Be star that crosses the line of sight toward the companion in some phases – and only some phases, since no such absorption should occur when the companion appears in front of the Be star. The absence of phase-locked variations in the absorbing column of ζ Tau was noted earlier, but another point can be made in this context. Using the same disk model as in Sec. 4.2, the absorbing column toward an emission region located in the equatorial plane, at 252 R⊙ of the Be star (i.e. at the expected distance of the companion in ζ Tau, Ruždjak et al. 2009; Rauw 2024), can be calculated. For the favored inclination angle of 85° and considering the worst case (i.e. with the Be star in front of its companion), we find values of 0.6–8 × 1022 cm−2, depending on the chosen set of disk parameters. Lower inclinations (75–80°) yield much lower columns (<2 × 1022 cm−2), while inclinations close to 90° would lead to an eclipse of the X-ray emission zone, which has not been detected. The predicted absorption due to the disk should thus be (much) lower than observed which, combined to the absence of phase-locked modulation, suggests that the accretion scenario requires another absorber, close to the WD, to ensure orbital phase independence. The best candidate is of course linked to the accreting flows themselves and we now examine observational results regarding such absorption.
In non-magnetic CVs such as dwarf novae, the disk extends down to the WD surface and X-rays are emitted from a boundary layer that may be optically thin at low to medium accretion rates with temperatures similar to those of γ Cas analogs (Patterson & Raymond 1985). Since we assumed decretion and accretion disks to be virtually coplanar and since ζ Tau is seen under a high inclination, we focus on cases of high-inclination CVs. A select number of dwarf novae in the quiescent state exhibit high inclination (Mukai 2017). For instance, XMM-Newton observations of OY Car (i = 83°, LX ~ 5 × 1030 erg s−1) require NH ~ 1022 cm−2, with a covering fraction of ~50% (Pandel et al. 2005). HT Cas (i = 81°, LX = 1.33 × 1031 erg s−1) displays NH ~ 1.6–3.3 × 1021 cm−2 (Nucita et al. 2009). In a similar manner, the X-ray spectrum of the partially eclipsing dwarf nova V893 Sco (i ~ 74°, Lx ~ 1.1 × 1032 erg s−1) shows NH ~ 3–6 × 1021 cm−2 with a covering fraction of ~ 55% (Mukai et al. 2009). These observations suggest that, among dwarf novae, the optically thin X-ray emitting boundary layer extends above the optically thick accretion disk which therefore does not block the view toward the emitting region (Mukai 2017): any emission arising there is not fully absorbed by the disk. Noticeably, the hard X-ray luminosities radiated by such sources in quiescence often are one or two orders of magnitude below those emitted by γ Cas analogs. For larger mass accretion rates, the boundary layer becomes optically thick, leading to enhanced UV and soft X-ray emission. With their ~ 100-fold higher ![Mathematical equation: $\[\dot{M}\]$](/articles/aa/full_html/2024/08/aa49737-24/aa49737-24-eq16.png) , dwarf novae in outburst and nova-like objects still exhibit hard X-ray luminosities in the range of 1029 to 1032 erg s−1 (see e.g. Balman 2020 and Suleimanov et al. 2022). In the few cases documented, nova-like X-ray spectra require NH ≤ 1022 cm−2 (Zemko et al. 2014). It is therefore unclear how disk accretion onto a WD could account for the high NH, high temperature, and high intrinsic X-ray luminosity of ζ Tau.
, dwarf novae in outburst and nova-like objects still exhibit hard X-ray luminosities in the range of 1029 to 1032 erg s−1 (see e.g. Balman 2020 and Suleimanov et al. 2022). In the few cases documented, nova-like X-ray spectra require NH ≤ 1022 cm−2 (Zemko et al. 2014). It is therefore unclear how disk accretion onto a WD could account for the high NH, high temperature, and high intrinsic X-ray luminosity of ζ Tau.
If the WD magnetic field strength is high enough to drive accretion onto its magnetic poles, the inner part of the accretion disk may be truncated as in IPs. For even higher magnetic fields (as in polars), matter falls ballistically from L1 onto the WD and is later captured by the magnetosphere without forming an accretion disk (see de Martino et al. 2020 for a recent review). In such systems, most of the photoelectric absorption takes place in the pre-shock material located above the X-ray emitting region of the accretion column. Since X-rays emitted in the shock cross different amounts of pre-shock matter, the emerging X-ray spectrum is best described by a partially covering absorber or a more physically motivated distribution of absorbing columns (Done & Magdziarz 1998). The XMM-Newton survey of IPs carried out by Bernardini et al. (2017) reveals the presence of thick photoelectric absorbers with NH in the range of 1.6–8.7 × 1023 cm−2 with covering fractions spanning from 33 to 76%. Additional orbital phase-dependent absorption often occurs in IPs at a level of 1022 cm−2 (Parker et al. 2005). This absorbing component is believed to be due to the bulge created by the stream of matter impacting the external part of the accretion disk. Few IPs are known to display eclipses testifying to a high inclination. The best documented case is XY Ari (Zengin Ćamurdan et al. 2018). Best fits to its X-ray spectrum require a complex absorption pattern consisting of a global NH of ~ 3 × 1022 cm−2 and two partial absorbers with NH ~ 1024 cm−2 and ~ 6 × 1022 cm−2 with covering fractions of 41 and 53% respectively. Polars exhibit similar partial absorptions with coverage of ~50% and NH of up to a few 1023 cm−2 (Bernardini et al. 2014; Traulsen et al. 2014; Rawat et al. 2023). Additional narrow absorption features due to streams of matter crossing the line of sight may also occur as in AM Her (Schwope et al. 2020) with a further absorbing column of 4.1 × 1023 cm−2 and a covering fraction of 93%. EX Hydrae is an intermediate case between IPs and polars where the WD has a 67 min spin period not yet synchronized with the 98 min orbital period. It also shows partial eclipses by the mass donor star. In spite of the high inclination, photoelectric absorption reaches only a few 1021 cm−2 (Allan et al. 1998). In fact, since the bulk of the photoelectric absorption in magnetic CVs occurs in the stream of matter driven by the strong magnetic field, there should be no inclination effect as the magnetic field orientation is a priori unrelated to that of the accretion disk. Indeed, high inclination systems do not exhibit much enhanced absorption, and absorption is always partial. This seems at odds with the observations of γ Cas in general and ζ Tau in particular, with its higher absorbing column. This is a second argument, after the non-detection of stable WD spin signals, against the magnetic configuration.
A small group of symbiotic stars, called “δ-type” objects, emit optically thin thermal hard X-rays with temperatures in the range of 15 to 30 keV and X-ray luminosities of ~ 1033 erg s−1 (Kennea et al. 2009), comparable with those of γ Cas analogs. Global intrinsic absorption with NH ≤ 2 × 1022 cm−2 is observed, in addition to partially covering components of up to ~ 3 × 1023 cm−2 with covering fractions as high as 96% (Kennea et al. 2009). Although accretion mostly occurs through stellar wind, a disk may form around the WD (Balman 2020). For example, the hard component of T CrB has an X-ray luminosity of ~6 × 1032 erg s−1 and is best fitted with a cooling flow (kTMax ≈ 15 keV) absorbed by NH = 3–7 × 1023 cm−2 with an extremely high partial covering factor of 99.7% (Luna et al. 2018; Zhekov & Tomov 2019). A luminous soft black body appears in the active state, and so these authors interpret the soft and hard X-ray component as being due to the emission of the boundary layer, with the change of state of T CrB being equivalent to the quiescent to outburst transition in dwarf novae. However, RT Cru, another δ-type symbiotic star, fails to show the dwarf nova behavior of TCrB (Luna et al. 2018). Classical CVs do not exhibit such a high covering factor of their hard X-ray component, suggesting that the accretion geometry in δ-type symbiotic stars is significantly different, in particular the visibility of the boundary layer. It is striking that the observed absorption and covering factors of TCrB are almost identical with those we derive for ζ Tau. However, if the symbiotic star scenario applies to γ Cas analogs, the rather moderate (~60°) inclination of TCrB (Belczynski & Mikolajewska 1998) would imply similarly high absorptions and covering factors in other γ Cas analogs (which are seen at lower inclinations than ζ Tau). This is not observed. Moreover, in the absence of known eclipsing δ-type symbiotic stars, the role played by the accretion disk at high inclinations remains uncertain. While symbiotics are the most promising WD proxies for γ Cas stars, much remains to be done to clarify their behavior in γ Cas-like orbital geometries.
5 Conclusions and summary
It was recently discovered that the ζ Tau binary displays the peculiar X-ray characteristics of γ Cas analogs. To further characterize its properties, the system was the target of an XMM-Newton campaign. The exposures were obtained at two specific orbital phases, first when the Be star (whose disk is seen edge-on) was in front of its companion and then in the opposite orbital configuration. These X-ray observations were complemented by archival X-ray (Chandra, eROSITA) and optical (TESS, BeSS) data.
The XMM-Newton light curves present significant changes occurring with various timescales. As with other γ Cas stars, no persistent periodic signal is detected. Rather, the variability amplitude appears to decrease with increasing frequency, the power spectrum approximately following P ∝ 1/f as was found in γ Cas. The ratio between count rates in the 1.5–4.0 and 4.0–10.0 keV energy bands varies from epoch to epoch, but it remains stable during each of the XMM-Newton exposures: the variations are thus gray on short timescales. The ratio between count rates in 0.5–1.5 and 4.0–10.0 keV is noisier and seems to slightly decrease at the end of the first XMM-Newton-pn exposure. This may suggest the occurrence of a transient, shallow “softness dip” that could be related to a slight increase in absorption toward the warm plasma. In the optical, TESS data of ζ Tau seem quite typical for a Be star, with broad frequency groups appearing at low frequencies and no significant high-frequency (10–360 day−1) signal.
The X-ray spectrum presents a very faint soft component and a bright hard component. The intensity of the former appears in line with those recorded for non-γ Cas Be stars and could therefore correspond to intrinsic X-rays from the wind of the massive star. The hard component suffers from a strong absorbing column (at least 1023 cm−2) that significantly varies up to a factor of a few. This absorption variation does not appear phase-locked, nor is it correlated with the properties (overall strength, (a)symmetry, depth of the core absorption) of the Hα line, the usual Be disk tracer.
These observed properties challenge the proposed scenarios to explain the X-ray emission of γ Cas analogs. The observed absence of orbital modulation is expected for a star-disk interaction scenario. In addition, absorptions similar to the observed values can be reached in that scenario if the X-ray emission arises from near the star although not exactly at its equator but slightly above it. However, it remains to be seen how to reconcile this scenario with no (or little) correlation between X-ray and disk properties. For the accreting WD scenario, one could draw similarities between γ Cas analogs and some known accreting WDs regarding for example the frequency behavior of the stochastic variability, the high plasma temperature, the presence of a fluorescence line, and even the strong absorption. However, it remains unclear if the full set of characteristics observed in γ Cas analogs can be found altogether in a single type of accreting WD. For example, CVs may display strong absorption, but only with a partial coverage, contrary to what is detected for ζ Tau. In addition, stable short-term modulations typically expected to be linked to the WD spin in IPs have not been detected in γ Cas analogs, nor any orbital modulation or any outburst typical of novae. It must be noted, however, that the detailed modeling of both scenarios for γ Cas-like configurations is still lacking, prohibiting a thorough testing. The availability of such modeling clearly constitutes an essential step in our way toward understanding γ Cas analogs.
Acknowledgements
Y.N. and G.R. acknowledge support from the Fonds National de la Recherche Scientifique (Belgium), the European Space Agency (ESA) and the Belgian Federal Science Policy Office (BELSPO) in the framework of the PRODEX Programme (contracts linked to XMM-Newton). M.A.S. acknowledges support from Chandra grant #362675 to Catholic University of America. J.R. acknowledges support from the DLR under grant 50QR2105. ADS and CDS were used for preparing this document. This work has made use of the AAVSO repository (https://www.aavso.org) and BeSS database, operated at LESIA, Observatoire de Meudon, France (http://basebe.obspm.fr). This work uses data from eROSITA, the soft X-ray instrument aboard SRG.
References
- Asplund, M., Grevesse, N., Sauval, A. J., et al. 2009, ARA&A, 47, 481 [Google Scholar]
- Allan, A., Hellier, C., & Beardmore, A. 1998, MNRAS, 295, 167 [CrossRef] [Google Scholar]
- Balman, Ş. 2019, Astron. Nachr., 340, 296 [NASA ADS] [CrossRef] [Google Scholar]
- Balman, Ş. 2020, Adv. Space Res., 66, 1097 [NASA ADS] [CrossRef] [Google Scholar]
- Beardmore, A. P., & Osborne, J. P. 1997, MNRAS, 290, 145 [NASA ADS] [Google Scholar]
- Belczynski, K., & Mikolajewska, J. 1998, MNRAS, 296, 77 [CrossRef] [Google Scholar]
- Bernardini, F., de Martino, D., Mukai, K., et al. 2014, MNRAS, 445, 1403 [NASA ADS] [CrossRef] [Google Scholar]
- Bernardini, F., de Martino, D., Mukai, K., et al. 2017, MNRAS, 470, 4815 [NASA ADS] [CrossRef] [Google Scholar]
- Carciofi, A. C., Okazaki, A. T., Le Bouquin, J.-B., et al. 2009, A&A, 504, 915 [NASA ADS] [CrossRef] [EDP Sciences] [Google Scholar]
- Christian, D. J. 2000, AJ, 119, 1930 [NASA ADS] [CrossRef] [Google Scholar]
- Cochetti, Y. R., Arcos, C., Kanaan, S., et al. 2019, A&A, 621, A123 [NASA ADS] [CrossRef] [EDP Sciences] [Google Scholar]
- Coe, M. J., Kennea, J. A., Evans, P. A., et al. 2020, MNRAS, 497, L50 [NASA ADS] [CrossRef] [Google Scholar]
- Cracco, V., Orio, M., Ciroi, S., et al. 2018, ApJ, 862, 167 [NASA ADS] [CrossRef] [Google Scholar]
- de Martino, D., Bernardini, F., Mukai, K., et al. 2020, Adv. Space Res., 66, 1209 [NASA ADS] [CrossRef] [Google Scholar]
- Done, C., & Magdziarz, P. 1998, MNRAS, 298, 737 [NASA ADS] [CrossRef] [Google Scholar]
- Ferrario, L., de Martino, D., & Gänsicke, B. T. 2015, Space Sci. Rev., 191, 111 [Google Scholar]
- Frank, J., King, A., & Raine, D. J. 2002, Accretion Power in Astrophysics, eds. J. Frank, A. King, & D. Raine (Cambridge, UK: Cambridge University Press), 398 [Google Scholar]
- Gies, D. R., Bagnuolo, W. G., Baines, E. K., et al. 2007, ApJ, 654, 527 [Google Scholar]
- Gies, D. R., Wang, L., & Klement, R. 2023, ApJ, 942, L6 [NASA ADS] [CrossRef] [Google Scholar]
- Ghosh, P., & Lamb, F. K. 1979, ApJ, 234, 296 [Google Scholar]
- Gosset, E., Royer, P., Rauw, G., et al. 2001, MNRAS, 327, 435 [NASA ADS] [CrossRef] [Google Scholar]
- Grundstrom, E. D., & Gies, D. R. 2006, ApJ, 651, L53 [NASA ADS] [CrossRef] [Google Scholar]
- Hamaguchi, K., Oskinova, L., Russell, C. M. P., et al. 2016, ApJ, 832, 140 [NASA ADS] [CrossRef] [Google Scholar]
- Hayasaki, K., & Okazaki, A. T. 2004, MNRAS, 350, 971 [NASA ADS] [CrossRef] [Google Scholar]
- Hermes, J. J., Gänsicke, B. T., Kawaler, S. D., et al. 2017, ApJS, 232, 23 [Google Scholar]
- Hickox, R. C., Narayan, R., & Kallman, T. R. 2004, ApJ, 614, 881 [NASA ADS] [CrossRef] [Google Scholar]
- Itoh, K., Okada, S., Ishida, M., et al. 2006, ApJ, 639, 397 [CrossRef] [Google Scholar]
- Kahabka, P., Haberl, F., Payne, J. L., et al. 2006, A&A, 458, 285 [NASA ADS] [CrossRef] [EDP Sciences] [Google Scholar]
- Kennea, J. A., Mukai, K., Sokoloski, J. L., et al. 2009, ApJ, 701, 1992 [NASA ADS] [CrossRef] [Google Scholar]
- Kennea, J. A., Coe, M. J., Evans, P. A., et al. 2021, MNRAS, 508, 781 [NASA ADS] [CrossRef] [Google Scholar]
- Labadie-Bartz, J., Carciofi, A. C., Henrique de Amorim, T., et al. 2022, AJ, 163, 226 [NASA ADS] [CrossRef] [Google Scholar]
- Langer, N., Baade, D., Bodensteiner, J., et al. 2020, A&A, 633, A40 [NASA ADS] [CrossRef] [EDP Sciences] [Google Scholar]
- Li, K. L., Kong, A. K. H., Charles, P. A., et al. 2012, ApJ, 761, 99 [NASA ADS] [CrossRef] [Google Scholar]
- Lopes de Oliveira, R., Smith, M. A., & Motch, C. 2010, A&A, 512, A22 [NASA ADS] [CrossRef] [EDP Sciences] [Google Scholar]
- Luna, G. J. M., Mukai, K., Sokoloski, J. L., et al. 2018, A&A, 619, A61 [NASA ADS] [CrossRef] [EDP Sciences] [Google Scholar]
- Luna, G. J. M., Mukai, K., Sokoloski, J. L., et al. 2018, A&A, 616, A53 [NASA ADS] [CrossRef] [EDP Sciences] [Google Scholar]
- Martin, R. G., Nixon, C., Armitage, P. J., et al. 2014, ApJ, 790, L34 [NASA ADS] [CrossRef] [Google Scholar]
- Motch, C., Lopes de Oliveira, R., & Smith, M. A. 2015, ApJ, 806, 177 [NASA ADS] [CrossRef] [Google Scholar]
- Mukai, K. 2017, PASP, 129, 062001 [Google Scholar]
- Mukai, K., Zietsman, E., & Still, M. 2009, ApJ, 707, 652 [NASA ADS] [CrossRef] [Google Scholar]
- Nazé, Y., & Motch, C. 2018, A&A, 619, A148 [NASA ADS] [CrossRef] [EDP Sciences] [Google Scholar]
- Nazé, Y., & Robrade, J. 2023, MNRAS, 525, 4186 [CrossRef] [Google Scholar]
- Nazé, Y., Rauw, G., & Cazorla, C. 2017, A&A, 602, L5. [NASA ADS] [CrossRef] [EDP Sciences] [Google Scholar]
- Nazé, Y., Rauw, G., & Smith, M. 2019, A&A, 632, A23 [NASA ADS] [CrossRef] [EDP Sciences] [Google Scholar]
- Nazé, Y., Rauw, G., & Pigulski, A. 2020, MNRAS, 498, 3171 [CrossRef] [Google Scholar]
- Nazé, Y., Rauw, G., Czesla, S., et al. 2022a, MNRAS, 510, 2286 [CrossRef] [Google Scholar]
- Nazé, Y., Rauw, G., Bohlsen, T., et al. 2022b, MNRAS, 512, 1648 [CrossRef] [Google Scholar]
- Nazé, Y., Rauw, G., Smith, M. A., et al. 2022c, MNRAS, 516, 3366 [CrossRef] [Google Scholar]
- Nazé, Y., Guarro Flo, J., Leduc, A., et al. 2024, OEJV, 246, https://www.doi.org/10.5817/OEJV2024-0246 [Google Scholar]
- Nucita, A. A., Maiolo, B. M. T. Carpano, S., et al. 2009, A&A, 504, 973 [NASA ADS] [CrossRef] [EDP Sciences] [Google Scholar]
- Okazaki, A. T., Hayasaki, K., & Moritani, Y. 2013, PASJ, 65, 41 [NASA ADS] [Google Scholar]
- Orio, M., Nelson, T., Bianchini, A., et al. 2010, ApJ, 717, 739 [CrossRef] [Google Scholar]
- Pandel, D., Córdova, F. A., Mason, K. O., et al. 2005, ApJ, 626, 396 [NASA ADS] [CrossRef] [Google Scholar]
- Parker, T. L., Norton, A. J., & Mukai, K. 2005, A&A, 439, 213 [NASA ADS] [CrossRef] [EDP Sciences] [Google Scholar]
- Patterson, J., & Raymond, J. C. 1985, ApJ, 292, 535 [NASA ADS] [CrossRef] [Google Scholar]
- Pollmann, E. 2017, Inform. Bull. Variable Stars, 6208, 1 [Google Scholar]
- Pols, O. R., Cote, J., Waters, L. B. F. M., et al. 1991, A&A, 241, 419 [NASA ADS] [Google Scholar]
- Postnov, K., Oskinova, L., & Torrejón, J. M. 2017, MNRAS, 465, L119 [Google Scholar]
- Quirrenbach, A., Bjorkman, K. S., Bjorkman, J. E., et al. 1997, ApJ, 479, 477 [NASA ADS] [CrossRef] [Google Scholar]
- Rauw, G., Nazé, Y., Motch, C., et al. 2022, A&A, 664, A184 [NASA ADS] [CrossRef] [EDP Sciences] [Google Scholar]
- Rauw, G. 2024, A&A, 682, A179 [NASA ADS] [CrossRef] [EDP Sciences] [Google Scholar]
- Rawat, N., Pandey, J. C., Joshi, A., et al. 2023, MNRAS, 521, 2729 [CrossRef] [Google Scholar]
- Revnivtsev, M., Potter, S., Kniazev, A., et al. 2011, MNRAS, 411, 1317 [NASA ADS] [CrossRef] [Google Scholar]
- Ruždjak, D., Božić, H., Harmanec, P., et al. 2009, A&A, 506, 1319 [NASA ADS] [CrossRef] [EDP Sciences] [Google Scholar]
- Schaefer, G. H., Gies, D. R., Monnier, J. D., et al. 2010, AJ, 140, 1838 [NASA ADS] [CrossRef] [Google Scholar]
- Schwarz, R., Reinsch, K., Beuermann, K., et al. 2005, A&A, 442, 271 [NASA ADS] [CrossRef] [EDP Sciences] [Google Scholar]
- Schwope, A. D., Worpel, H., Traulsen, I., et al. 2020, A&A, 642, A134 [NASA ADS] [CrossRef] [EDP Sciences] [Google Scholar]
- Shao, Y., & Li, X.-D. 2014, ApJ, 796, 37 [Google Scholar]
- Smith, M. A., & Lopes de Oliveira, R. 2019, MNRAS, 488, 5048. [NASA ADS] [CrossRef] [Google Scholar]
- Smith, M. A., Robinson, R. D., & Corbet, R. H. D. 1998, ApJ, 503, 877 [NASA ADS] [CrossRef] [Google Scholar]
- Smith, M. A., Cohen, D. H., Gu, M. F., et al. 2004, ApJ, 600, 972 [NASA ADS] [CrossRef] [Google Scholar]
- Smith, M. A., Lopes de Oliveira, R., & Motch, C. 2012a, ApJ, 755, 64 [NASA ADS] [CrossRef] [Google Scholar]
- Smith, M. A., Lopes de Oliveira, R., Motch, C., et al. 2012b, A&A, 540, A53 [NASA ADS] [CrossRef] [EDP Sciences] [Google Scholar]
- Smith, M. A., Lopes de Oliveira, R., & Motch, C. 2016, Adv. Space Res., 58, 782 [Google Scholar]
- Smith, M. A., Lopes de Oliveira, R., & Motch, C. 2017, MNRAS, 469, 1502. [NASA ADS] [CrossRef] [Google Scholar]
- Štefl, S., Rivinius, T., Carciofi, A. C., et al. 2009, A&A, 504, 929 [NASA ADS] [CrossRef] [EDP Sciences] [Google Scholar]
- Sturm, R., Haberl, F., Pietsch, W., et al. 2012, A&A, 537, A76 [NASA ADS] [CrossRef] [EDP Sciences] [Google Scholar]
- Suleimanov, V. F., Doroshenko, V., & Werner, K. 2022, MNRAS, 511, 4937 [NASA ADS] [CrossRef] [Google Scholar]
- Torrejón, J. M., Schulz, N. S., & Nowak, M. A. 2012, ApJ, 750, 75 [CrossRef] [Google Scholar]
- Touhami, Y., Gies, D. R., & Schaefer, G. H. 2011, ApJ, 729, 17 [NASA ADS] [CrossRef] [Google Scholar]
- Touhami, Y., Gies, D. R., Schaefer, G. H., et al. 2013, ApJ, 768, 128 [NASA ADS] [CrossRef] [Google Scholar]
- Traulsen, I., Reinsch, K., Schwarz, R., et al. 2010, A&A, 516, A76 [NASA ADS] [CrossRef] [EDP Sciences] [Google Scholar]
- Traulsen, I., Reinsch, K., Schwope, A. D., et al. 2011, A&A, 529, A116 [NASA ADS] [CrossRef] [EDP Sciences] [Google Scholar]
- Traulsen, I., Reinsch, K., Schwope, A. D., et al. 2014, A&A, 562, A42 [NASA ADS] [CrossRef] [EDP Sciences] [Google Scholar]
- Tycner, C., Hajian, A. R., Armstrong, J. T., et al. 2004, AJ, 127, 1194 [NASA ADS] [CrossRef] [Google Scholar]
- van Bever, J., & Vanbeveren, D. 1997, A&A, 322, 116 [NASA ADS] [Google Scholar]
- Wang, L., Gies, D. R., Peters, G. J., et al. 2021, AJ, 161, 248 [Google Scholar]
- Xu, X.-J., Wang, Q. D., & Li, X.-D. 2016, ApJ, 818, 136 [NASA ADS] [CrossRef] [Google Scholar]
- Zemko, P., Orio, M., Mukai, K., et al. 2014, MNRAS, 445, 869 [CrossRef] [Google Scholar]
- Zengin Ćamurdan, D., Balman, Ş., & Burwitz, V. 2018, MNRAS, 477, 4035 [CrossRef] [Google Scholar]
- Zhekov, S. A., & Tomov, T. V. 2019, MNRAS, 489, 2930 [NASA ADS] [CrossRef] [Google Scholar]
“Pile-up” in X-ray observations occurs when several photons impact the same pixel or neighbouring pixels during one observing frame (i.e. one read-out cycle). These photons are then erroneously recorded as a single photon with an energy corresponding to the sum of those of the incoming photons. One notable consequence is a spectral distortion, with the X-ray source appearing harder than it really is.
This bolometric luminosity is different from that used in Nazé & Robrade (2023). This luminosity difference mostly comes from a different choice of bolometric correction. It was based on the effective temperature of ζ Tau in Nazé et al. (2022c) and on the spectral type of ζ Tau in Nazé & Robrade (2023). However, the effective temperature of ζ Tau appears lower than usual for its spectral type.
See http://basebe.obspm.fr/basebe/ and the tables in Nazé et al. (2022c, 2024). The BeSS spectra closest to XMM-Newton observations were taken on 2023 March 20 and October 3, respectively; in other words, the optical and X-ray data were taken less than a day apart. A snapshot covering only the Hα line was taken five days before the Chandra exposure (on 2021 December 20) but the closest echelle spectrum is dated from 11 days before (2021 December 13). For eROSITA data, optical spectra covering Hα were taken within a day of the first two X-ray observations (2020 March 27 and September 29). The optical spectra closest to the third and fourth eROSITA observations were however taken 16 and 25 days later (2021 April 8 and October 28), respectively. Echelle spectra were obtained at even more distant dates.
Contrary to the case of neutron stars, the WD formation process is not expected to apply any significant kick to the orbit. If tidal spin alignment occurred during the mass-transfer episode that spun up the former secondary star (and now Be star), the orbital plane will nearly match that of the decretion disk and that of any accretion disk created around the WD. We therefore will consider the system coplanar in all its components.
All Tables
All Figures
|
Fig. 1 Field of view (15′ radius) of both XMM-Newton exposures (all EPIC cameras combined; March 2023 on top, October 2023 at the bottom). The yellow arcs mark the limit of the stray light contamination, the blue circles correspond to the source extraction regions (30″ radius), and the green circles are the background extraction regions (their size is limited by the “small window” mode: the smaller ones are for MOS cameras, the larger one for the pn camera). |
| In the text | |
|
Fig. 2 X-ray light curves recorded for ζ Tau with EPIC-MOS1 (left), MOS2 (middle) and pn (right) in the 0.5–10 keV energy band and for three time bins. The data points and their error bars are shown in red for the two longer bins. The first XMM-Newton observation is shown on top and the second one at bottom. |
| In the text | |
|
Fig. 3 Fourier transform of the EPIC-pn light curves in total band, shown with log-log scaling. The 10 and 100 s binning are used on top and bottom, respectively, and the first and second XMM-Newton observations are represented by the solid black and dotted red lines, respectively. The blue line provides A ∝ f−−0.75 while the green line shows A ∝ f−0.5. |
| In the text | |
|
Fig. 4 Curves in three energy bands and their ratios. Left and middle: EPIC light curves in the two XMM-Newton observations (March in the left panel, October in the middle panel) in the 0.5–1.5, 1.5–4., and 4–10 keV energy bands with a 1 ks time bin. EPIC-MOS1 data are shown with a solid black line and dots, MOS2 with a dashed red line and crosses, and pn with a dotted green line and triangles. Right: ratios of these count rates for the first (top) and second (bottom) XMM-Newton observations. |
| In the text | |
|
Fig. 5 TESS data of ζ Tau. Top: the TESS light curves of ζ Tau in sectors 43–45 (first panel) and 71–72 (second panel), with phase axis on top and Julian Date axis at the bottom. The third panel compares the data overlapping in orbital phase. Bottom: periodograms of the combined (43–45 and 71–72) light curves with insets showing the individual periodograms for each Sector. |
| In the text | |
|
Fig. 6 X-ray spectra recorded for ζ Tau by the EPIC-pn camera in the first (black) and second (red) XMM-Newton observations, along with their best-fit models (top of Table 1). |
| In the text | |
|
Fig. 7 Zoom on the 5–10 keV interval, showing the iron complex recorded by EPIC-pn in the second XMM-Newton observation, with the best-fit model superimposed. The top panel corresponds to the normal fit, while the bottom one makes uses of the response adjustment. |
| In the text | |
|
Fig. 8 Comparison of optical and X-ray characteristics. Top panel: radial velocities of the Be star in ζ Tau, measured from the Hα line using the double Gaussian method (filled triangles from Nazé et al. 2024 and empty triangles from the appendix of Nazé et al. 2022c) and phased with the ephemeris of Nazé et al. (2022c). Vertical lines show when X-ray observations were taken. Orbital phases 0 and 0.5 correspond to conjunctions with the Be star and its companion in front, respectively, while phases 0.25 and 0.75 correspond to quadratures. Bottom panels: comparison between the X-ray absorbing column and various diagnostics: orbital phase as well as EW, central absorption depth, and peak separation of the Hα line. The colors are the same as in the top panel. |
| In the text | |
|
Fig. 9 Optical behavior of ζ Tau. Top panels: evolution with time of EW and central depth of the Hα line from amateur spectra (BeSS database – black dots from Nazé et al. 2022c, circles from Nazé et al. 2024), as well as B, V magnitudes of ζ Tau as reported in the AAVSO database. Bottom panel: Hα line profiles at times closest to those of the X-ray observations. |
| In the text | |
|
Fig. 10 Evolution of the predicted absorbing column from disk material as a function of position above the equatorial plane z and various parameters (the baseline parameters are noted in black and the thick black line provides the associated column; θ = 0° everywhere unless otherwise stated). The observed range of columns is shown by the shaded light lavender area. |
| In the text | |
Current usage metrics show cumulative count of Article Views (full-text article views including HTML views, PDF and ePub downloads, according to the available data) and Abstracts Views on Vision4Press platform.
Data correspond to usage on the plateform after 2015. The current usage metrics is available 48-96 hours after online publication and is updated daily on week days.
Initial download of the metrics may take a while.