Fig. 5
Download original image
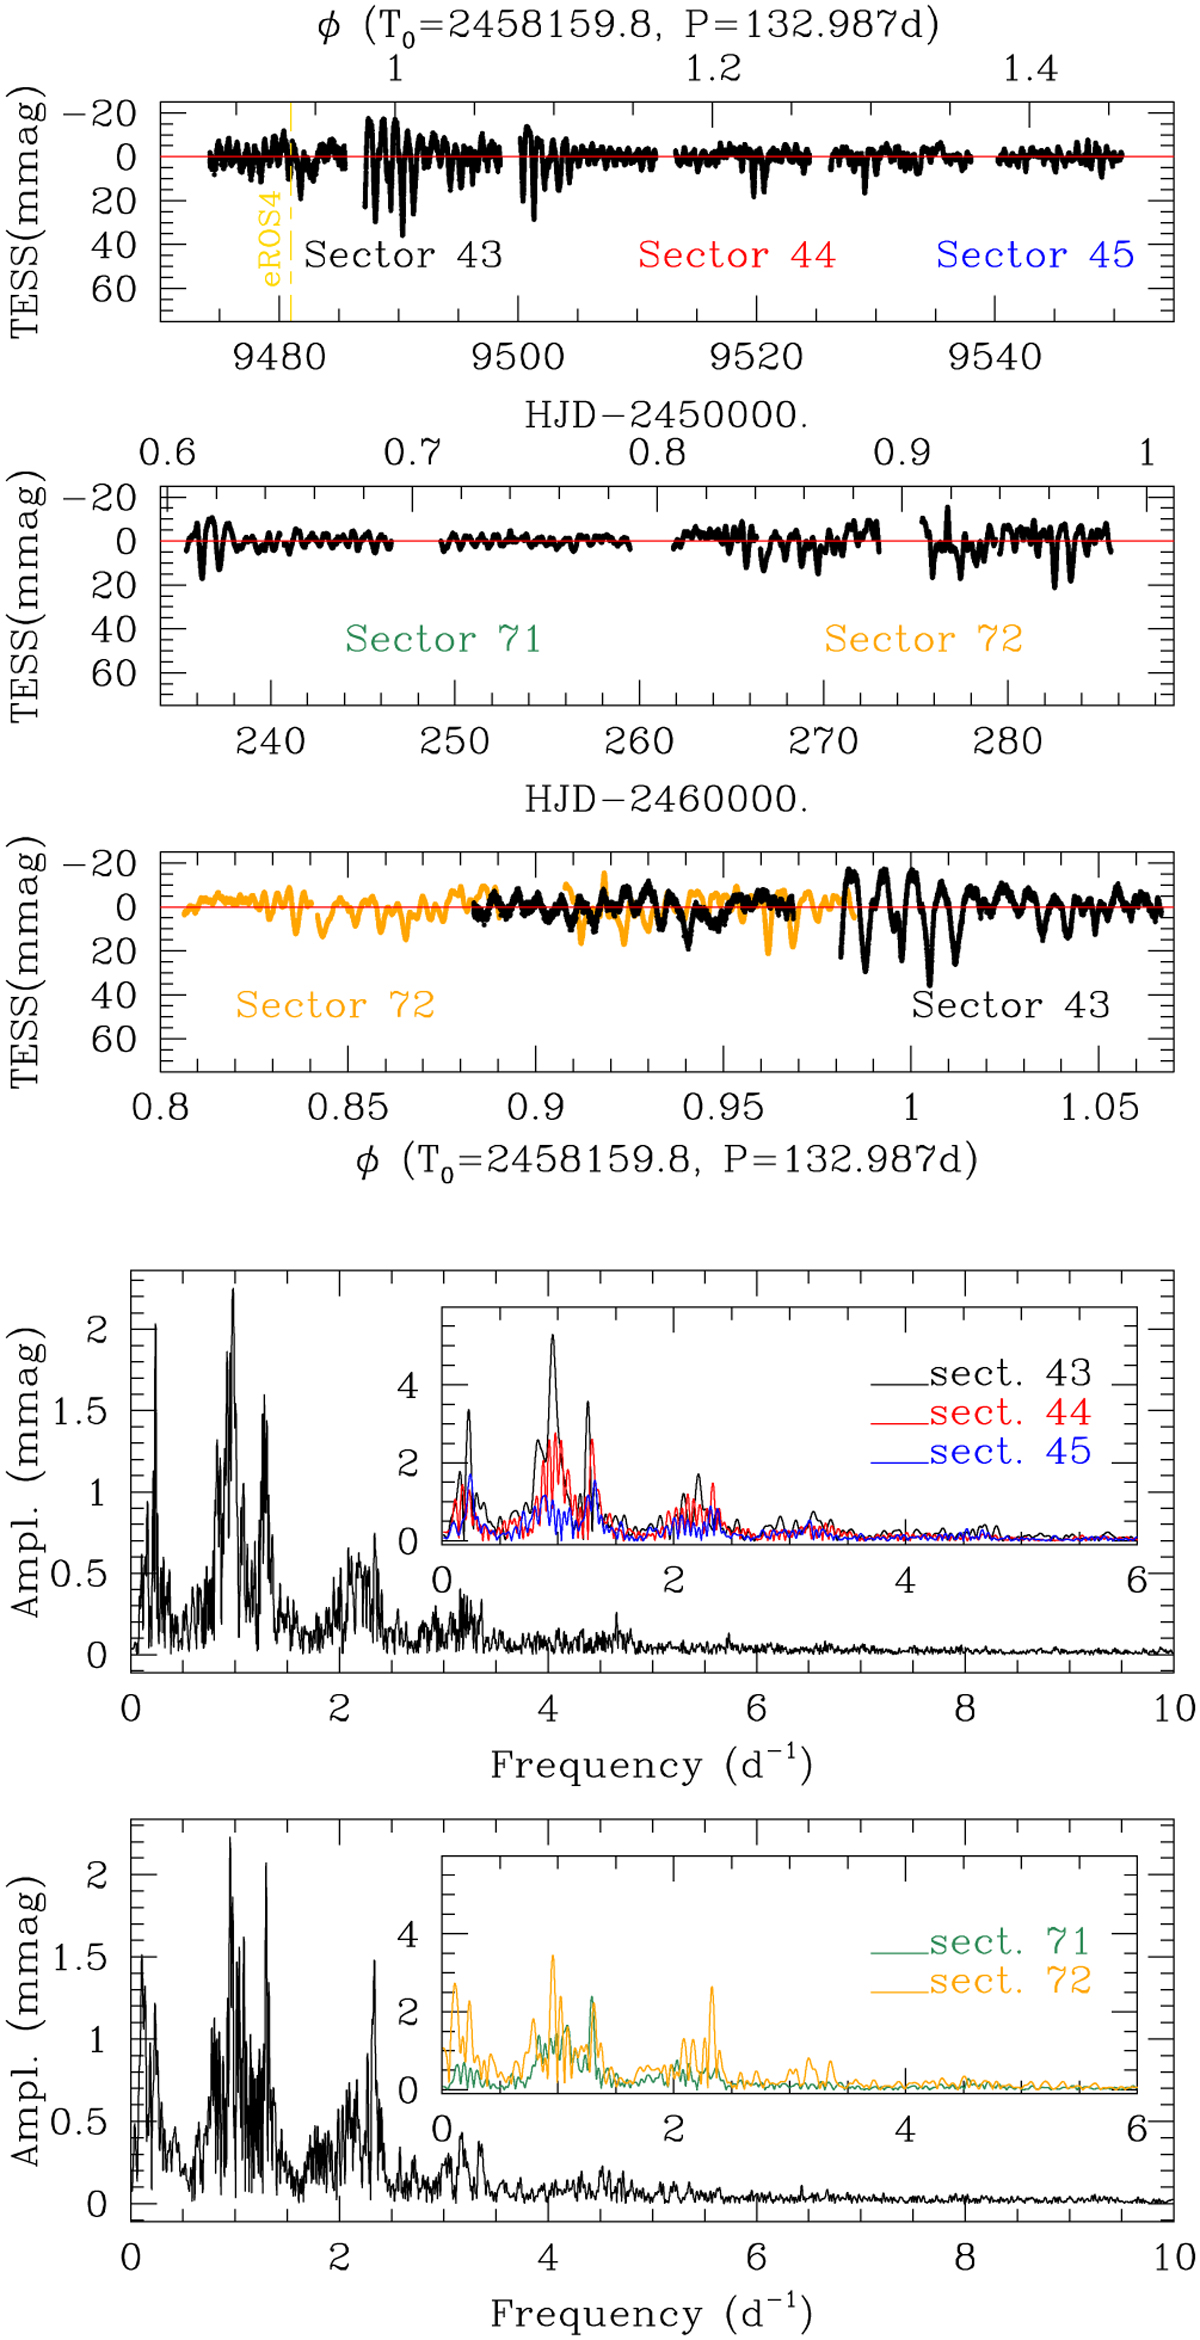
TESS data of ζ Tau. Top: the TESS light curves of ζ Tau in sectors 43–45 (first panel) and 71–72 (second panel), with phase axis on top and Julian Date axis at the bottom. The third panel compares the data overlapping in orbital phase. Bottom: periodograms of the combined (43–45 and 71–72) light curves with insets showing the individual periodograms for each Sector.
Current usage metrics show cumulative count of Article Views (full-text article views including HTML views, PDF and ePub downloads, according to the available data) and Abstracts Views on Vision4Press platform.
Data correspond to usage on the plateform after 2015. The current usage metrics is available 48-96 hours after online publication and is updated daily on week days.
Initial download of the metrics may take a while.