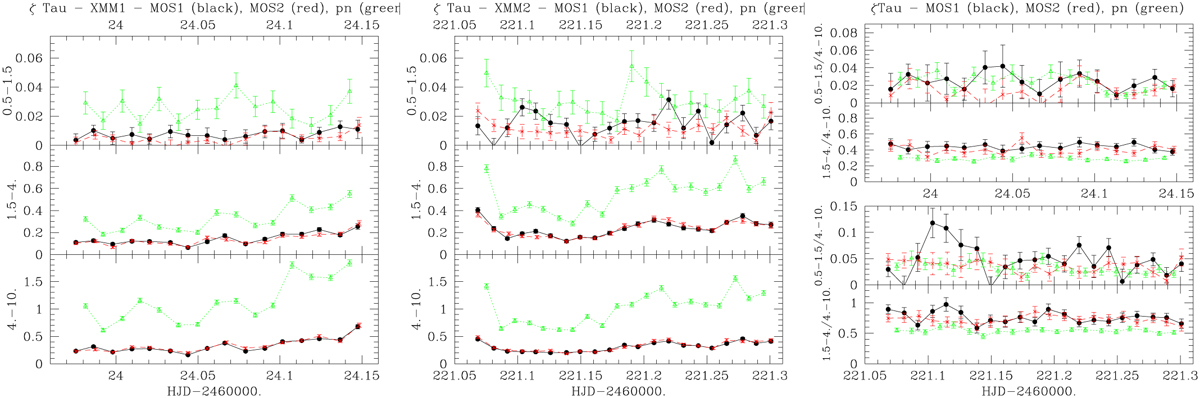
Fig. 4
Download original image
Curves in three energy bands and their ratios. Left and middle: EPIC light curves in the two XMM-Newton observations (March in the left panel, October in the middle panel) in the 0.5–1.5, 1.5–4., and 4–10 keV energy bands with a 1 ks time bin. EPIC-MOS1 data are shown with a solid black line and dots, MOS2 with a dashed red line and crosses, and pn with a dotted green line and triangles. Right: ratios of these count rates for the first (top) and second (bottom) XMM-Newton observations.
Current usage metrics show cumulative count of Article Views (full-text article views including HTML views, PDF and ePub downloads, according to the available data) and Abstracts Views on Vision4Press platform.
Data correspond to usage on the plateform after 2015. The current usage metrics is available 48-96 hours after online publication and is updated daily on week days.
Initial download of the metrics may take a while.