Open Access
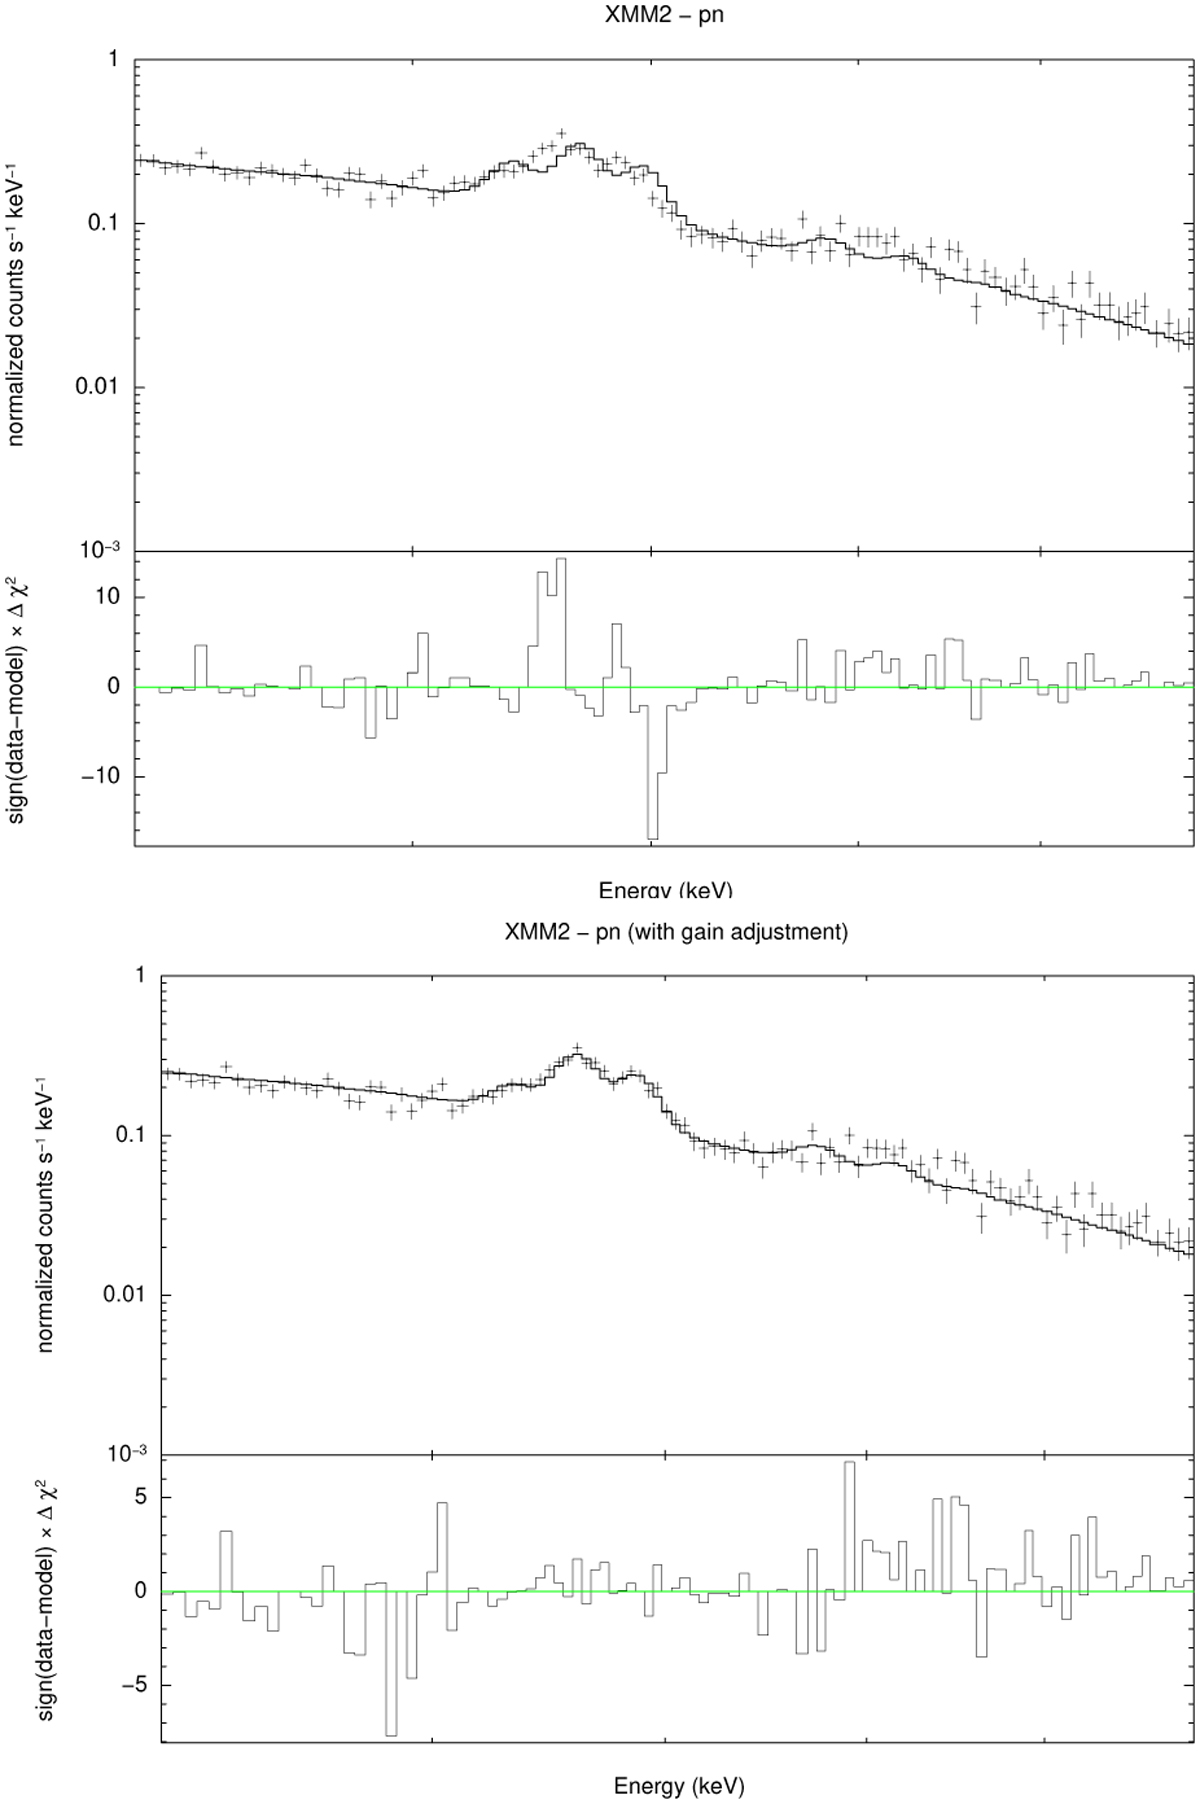
Fig. 7
Download original image
Zoom on the 5–10 keV interval, showing the iron complex recorded by EPIC-pn in the second XMM-Newton observation, with the best-fit model superimposed. The top panel corresponds to the normal fit, while the bottom one makes uses of the response adjustment.
Current usage metrics show cumulative count of Article Views (full-text article views including HTML views, PDF and ePub downloads, according to the available data) and Abstracts Views on Vision4Press platform.
Data correspond to usage on the plateform after 2015. The current usage metrics is available 48-96 hours after online publication and is updated daily on week days.
Initial download of the metrics may take a while.