Fig. 3
Download original image
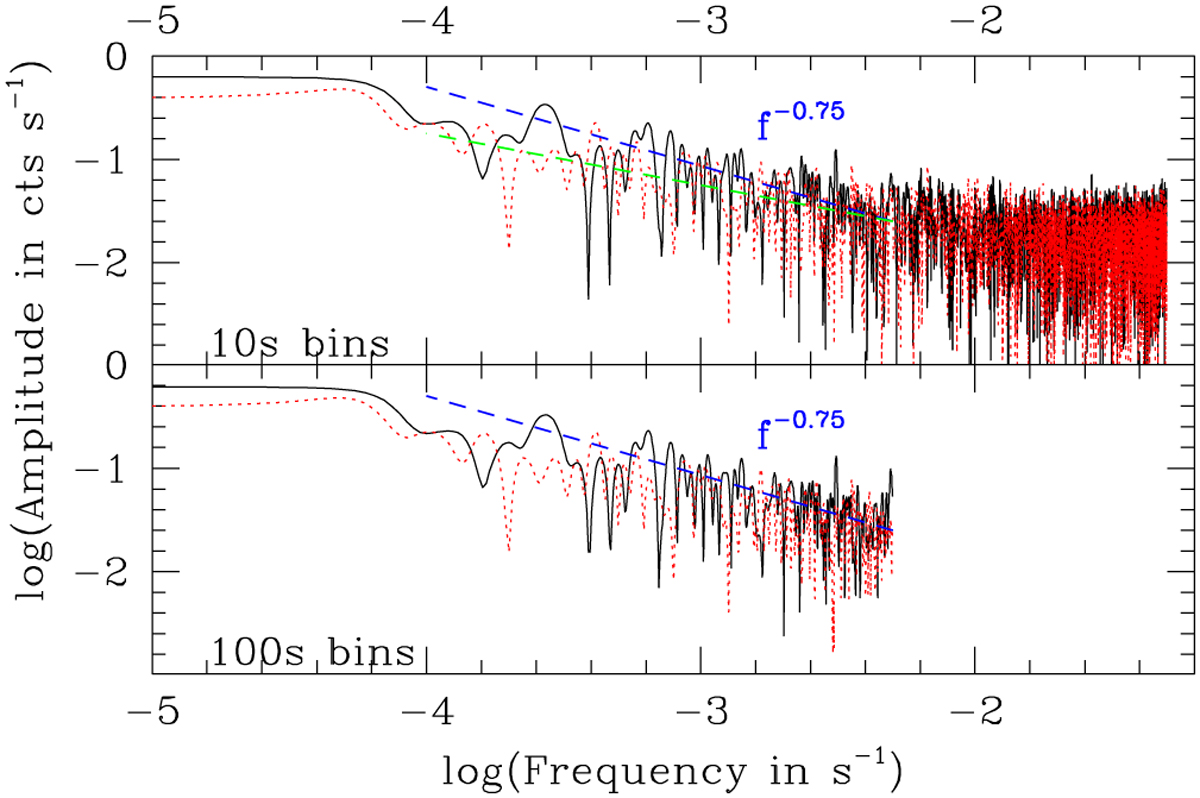
Fourier transform of the EPIC-pn light curves in total band, shown with log-log scaling. The 10 and 100 s binning are used on top and bottom, respectively, and the first and second XMM-Newton observations are represented by the solid black and dotted red lines, respectively. The blue line provides A ∝ f−−0.75 while the green line shows A ∝ f−0.5.
Current usage metrics show cumulative count of Article Views (full-text article views including HTML views, PDF and ePub downloads, according to the available data) and Abstracts Views on Vision4Press platform.
Data correspond to usage on the plateform after 2015. The current usage metrics is available 48-96 hours after online publication and is updated daily on week days.
Initial download of the metrics may take a while.