Fig. 5.
Download original image
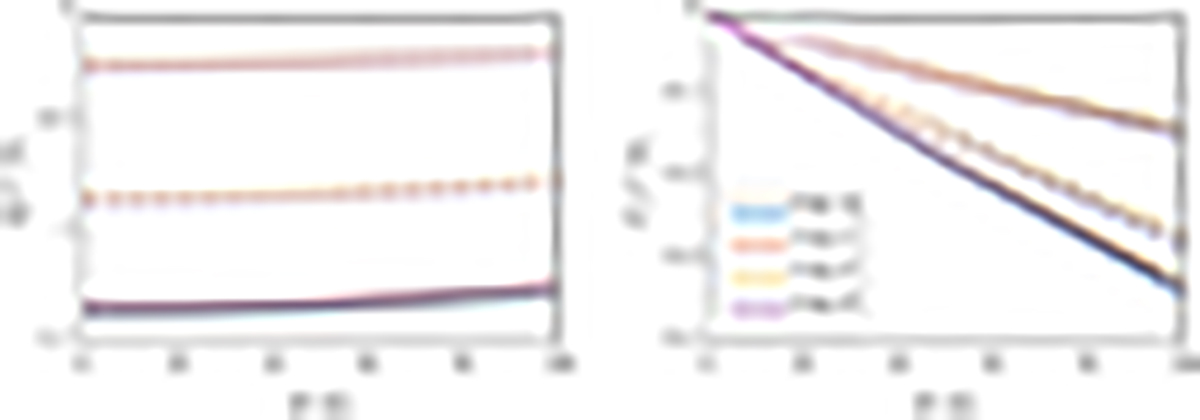
Plots of ![]() (left panel) and
(left panel) and ![]() (right panel) as function of B. The results are obtained by performing PRD–AD calculations for three LOSs with μ = 0.1, 0.6, and 0.9 (solid, dashed, and dash-dotted lines, respectively), χ = 0, and considering uniform horizontal (θB = π/2 and χB = 0) magnetic fields of different amplitudes. Blue, red, yellow, and purple lines correspond to profiles obtained with the FAL-A, FAL-C, FAL-F, and FAL-P atmospheric model, respectively.
(right panel) as function of B. The results are obtained by performing PRD–AD calculations for three LOSs with μ = 0.1, 0.6, and 0.9 (solid, dashed, and dash-dotted lines, respectively), χ = 0, and considering uniform horizontal (θB = π/2 and χB = 0) magnetic fields of different amplitudes. Blue, red, yellow, and purple lines correspond to profiles obtained with the FAL-A, FAL-C, FAL-F, and FAL-P atmospheric model, respectively.
Current usage metrics show cumulative count of Article Views (full-text article views including HTML views, PDF and ePub downloads, according to the available data) and Abstracts Views on Vision4Press platform.
Data correspond to usage on the plateform after 2015. The current usage metrics is available 48-96 hours after online publication and is updated daily on week days.
Initial download of the metrics may take a while.