Fig. 1.
Download original image
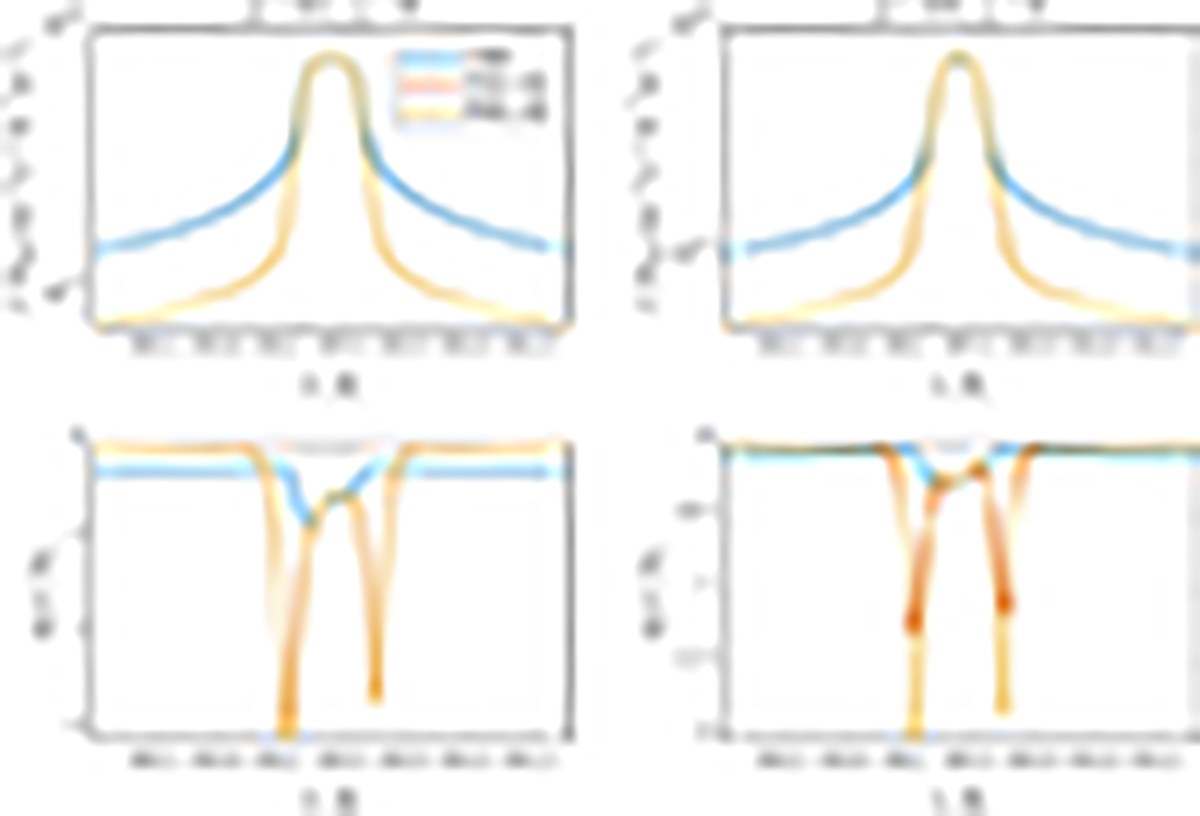
Stokes I (top panels) and Q/I (bottom panels) profiles for the He II Ly-α line as a function of wavelength. The results are obtained with the unmagnetised FAL-C atmospheric model and for two LOSs, near the limb (μ = 0.1, left panels) and near the disc centre (μ = 0.9, right panels), respectively. Blue, red, and yellow lines correspond to CRD, PRD–AA, and PRD–AD calculations, respectively. The intensity is in units of number of photons per unit of surface, time, wavelength, and solid angle. The intensity profiles for PRD–AA and PRD–AD calculations overlap.
Current usage metrics show cumulative count of Article Views (full-text article views including HTML views, PDF and ePub downloads, according to the available data) and Abstracts Views on Vision4Press platform.
Data correspond to usage on the plateform after 2015. The current usage metrics is available 48-96 hours after online publication and is updated daily on week days.
Initial download of the metrics may take a while.