Fig. 8
Download original image
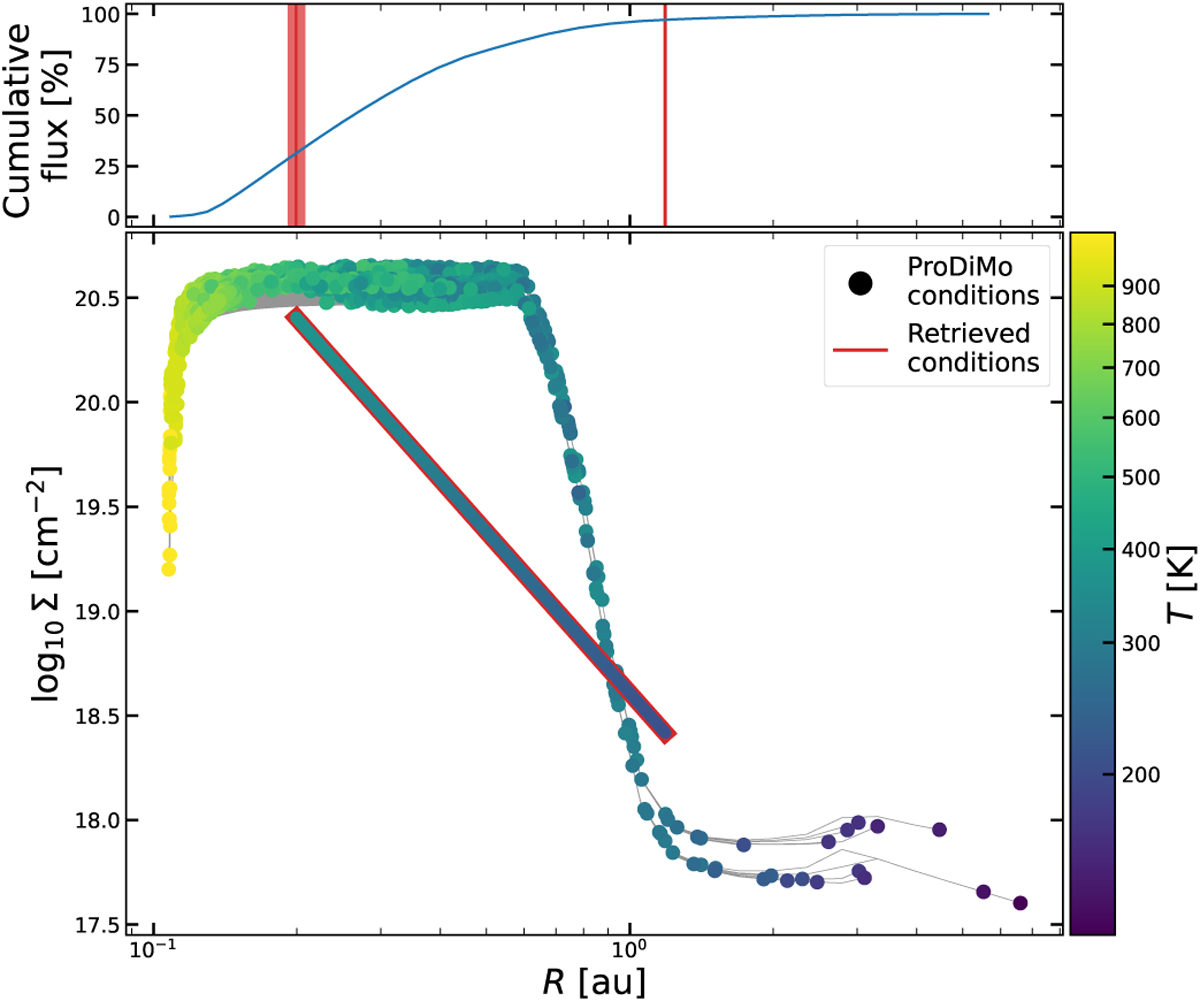
Comparison of the radii, column densities, and line emission temperatures of H2O extracted from ProDiMo with the retrieved parameter conditions. In the main panel, the horizontal axis shows the radius of the emission and the vertical axis the column density. Every H2O line with peak fluxes 3σ above the observational noise is selected to show the emitting conditions in ProDiMo. The grey lines show ![]() within the emitting region for the respective water lines. Every circle denote R0.15 and R0.85 for all emission lines with the colour indicating the temperature
within the emitting region for the respective water lines. Every circle denote R0.15 and R0.85 for all emission lines with the colour indicating the temperature ![]() . The column density power law retrieved by DuCKLinG is shown as a red outlined bar. It ranges from R0.15 to R0.85 with the surface colour illustrating the temperature at every radius. In the upper panel, the radial cumulative flux of H2O in ProDiMo (blue) with the from DuCKLinG retrieved R0.15 and R0.85 values with their uncertainties overplotted in red.
. The column density power law retrieved by DuCKLinG is shown as a red outlined bar. It ranges from R0.15 to R0.85 with the surface colour illustrating the temperature at every radius. In the upper panel, the radial cumulative flux of H2O in ProDiMo (blue) with the from DuCKLinG retrieved R0.15 and R0.85 values with their uncertainties overplotted in red.
Current usage metrics show cumulative count of Article Views (full-text article views including HTML views, PDF and ePub downloads, according to the available data) and Abstracts Views on Vision4Press platform.
Data correspond to usage on the plateform after 2015. The current usage metrics is available 48-96 hours after online publication and is updated daily on week days.
Initial download of the metrics may take a while.