Fig. 7
Download original image
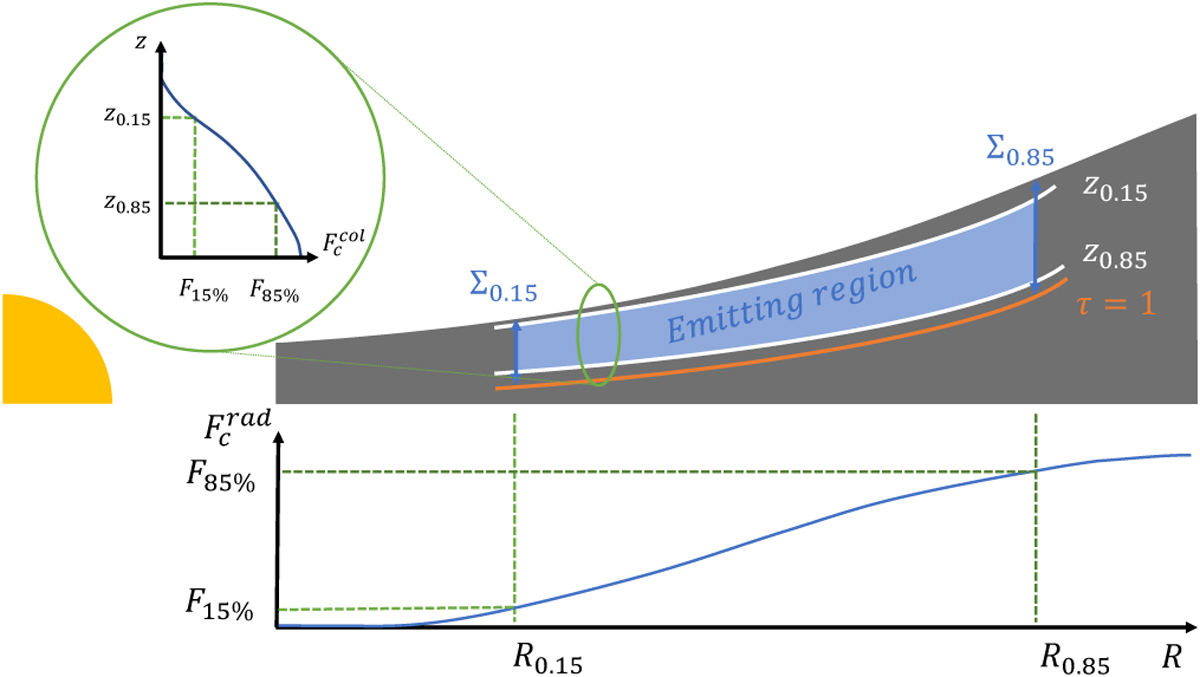
Sketch of the line emitting region in a ProDiMo disk model. The cumulative line flux as function of radius is shown in the lower part, and the cumulative line intensity at some given radius, as function of height, is sketched in the insert on the top left. We consider the region between R0.15 and R0.85 and between z0.15(r) and z0.85(r) as the line emitting region, where the respective cumulative quantities reach 15 and 85%, respectively, Σ0.15 and Σ0.85 are the column densities at R0.15 and R0.85 respectively.
Current usage metrics show cumulative count of Article Views (full-text article views including HTML views, PDF and ePub downloads, according to the available data) and Abstracts Views on Vision4Press platform.
Data correspond to usage on the plateform after 2015. The current usage metrics is available 48-96 hours after online publication and is updated daily on week days.
Initial download of the metrics may take a while.