Fig. 4
Download original image
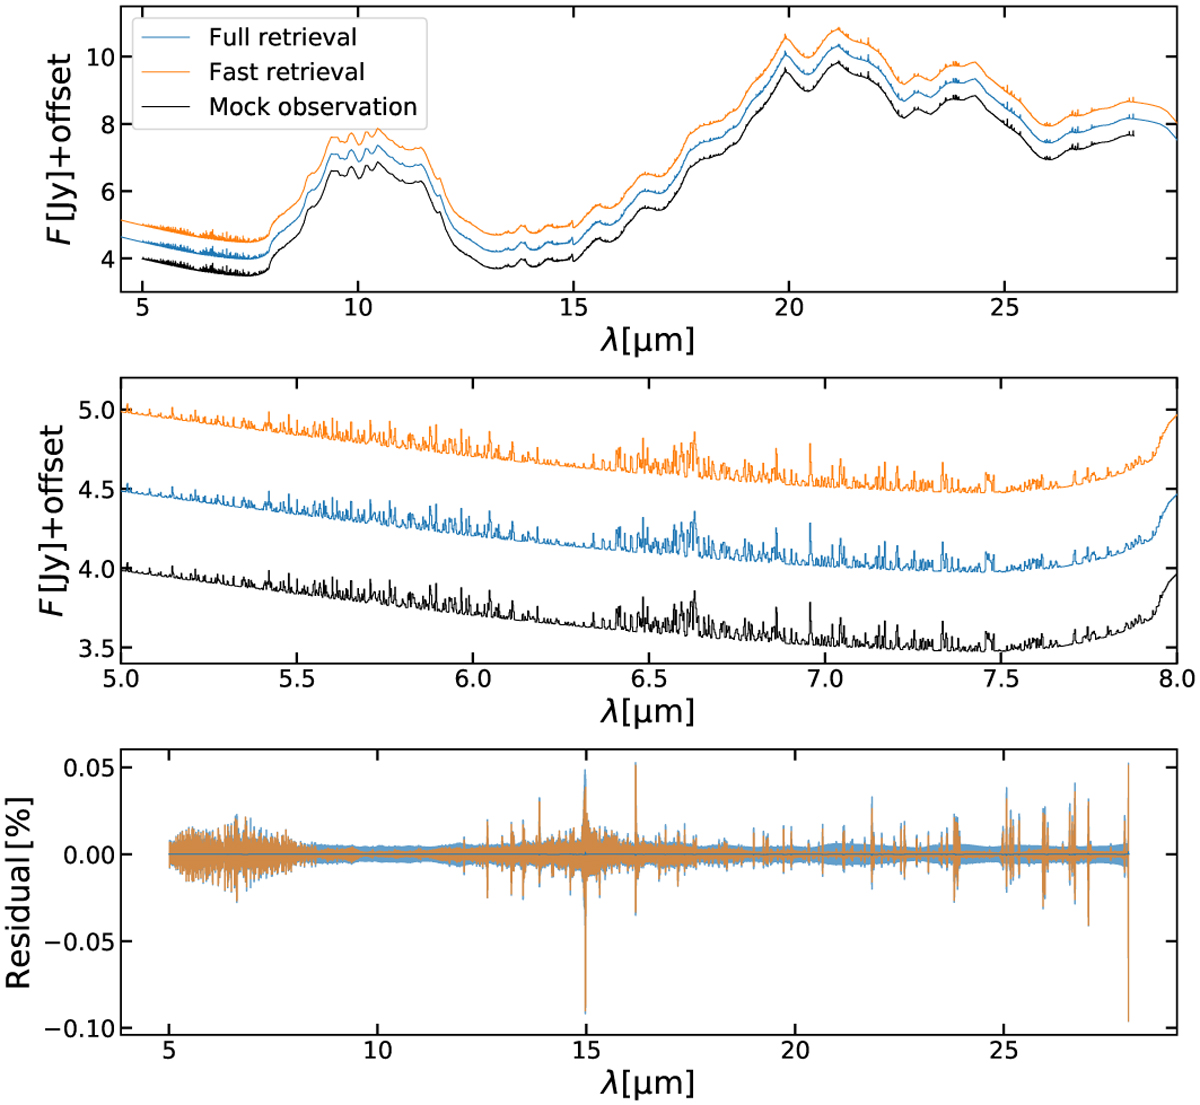
Comparison of the mock observations and the spectra from the two retrieval approaches. The mock observation is shown in black. The median spectrum from the posterior derived using the fast and full approach are shown in orange (shifted up by 1 Jy) and blue (shifted up by 0.5 Jy), respectively. While the upper panel shows the full wavelength range of the mock observation, the middle panel shows a zoom-in to the line-rich region around 6.5µm. The lower panel displays the residual (defined as ((Fobs – Fmode1)/Fobs) in percent between the two retrievals and the mock observation, with the coloured areas indicating the 1σ uncertainty of the retrieved fluxes.
Current usage metrics show cumulative count of Article Views (full-text article views including HTML views, PDF and ePub downloads, according to the available data) and Abstracts Views on Vision4Press platform.
Data correspond to usage on the plateform after 2015. The current usage metrics is available 48-96 hours after online publication and is updated daily on week days.
Initial download of the metrics may take a while.