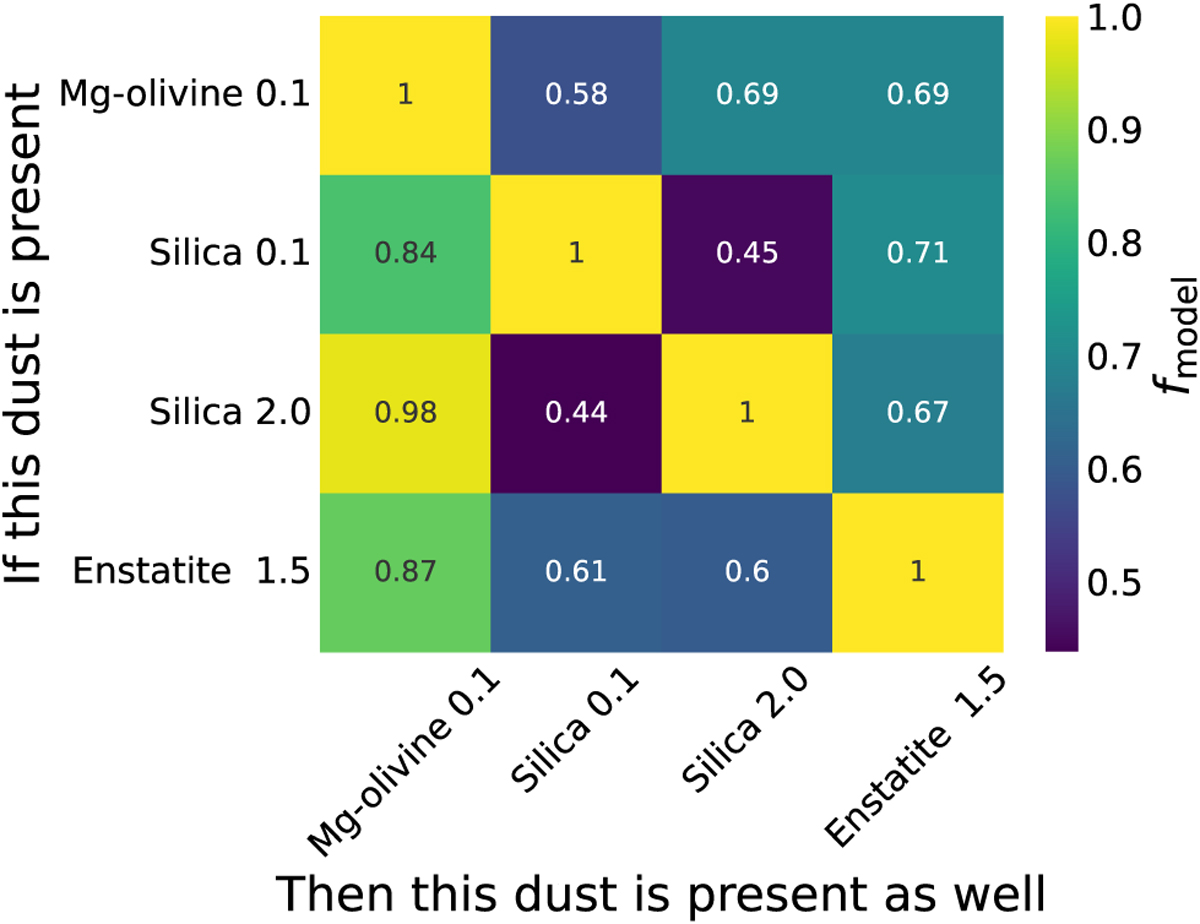
Fig. C.2
Download original image
Heatmap showing which dust species and sizes are simultaneously used to describe the MIRI spectrum of GW Lup. The plot should be read row by row. One row indicates all models of the posterior that include the dust species named on the y-axis. The single entries show the faction of models (ƒmodel) that use the dust species on the x-axis at the same time.
Current usage metrics show cumulative count of Article Views (full-text article views including HTML views, PDF and ePub downloads, according to the available data) and Abstracts Views on Vision4Press platform.
Data correspond to usage on the plateform after 2015. The current usage metrics is available 48-96 hours after online publication and is updated daily on week days.
Initial download of the metrics may take a while.