Fig. 9
Download original image
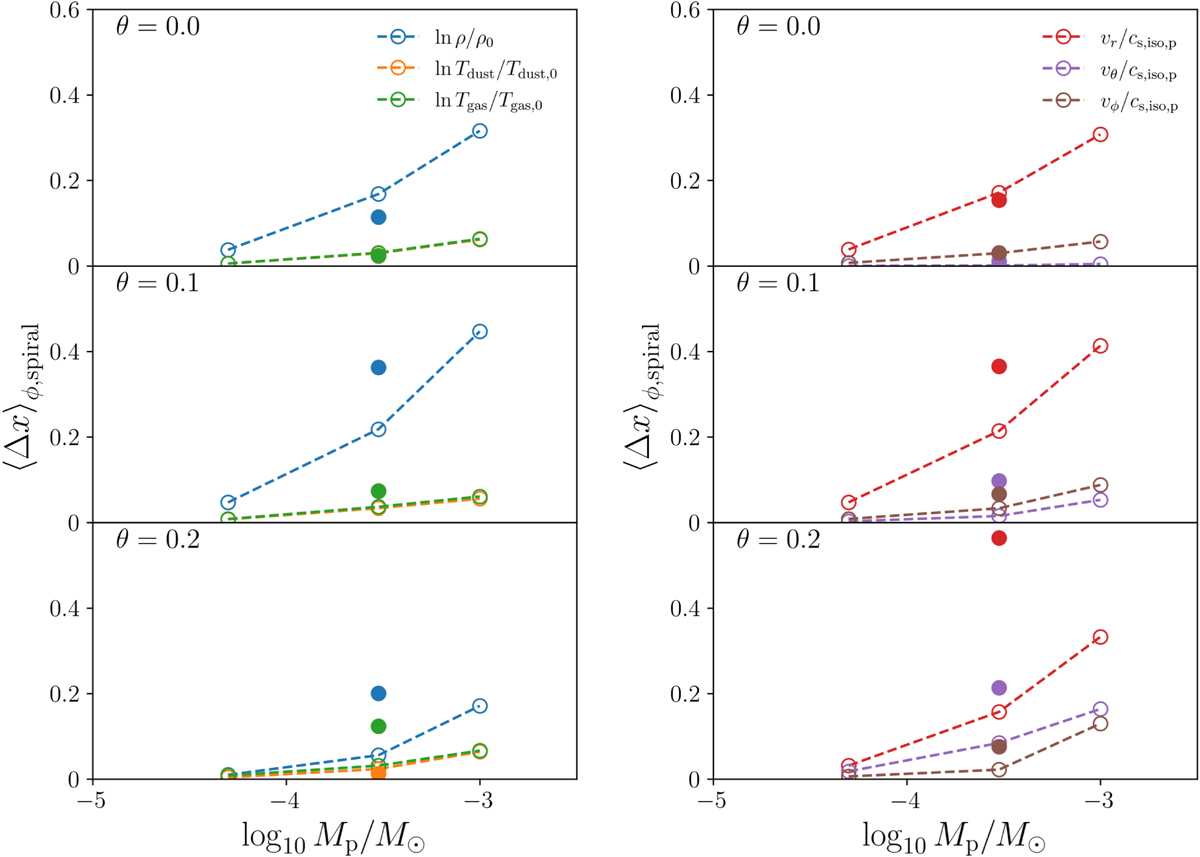
Measurement of the azimuthal perturbation in each normalized quantity x, averaged over an azimuthal range of ϕpeak ± 2hp according to Eq. (19). Densities and temperatures are plotted in the left panel and velocities in the right. Open circles indicate non-accreting planets, and closed circles indicate those with accretion luminosity (see Sect. 4.2 for a discussion). At z/r ≈ θ = 0.2, where dust and gas are not well coupled, the plotted Tdust amplitude reflects the radial “pseudo-arm” (see the discussion in Sect. 3.4) rather than the Lindblad spiral.
Current usage metrics show cumulative count of Article Views (full-text article views including HTML views, PDF and ePub downloads, according to the available data) and Abstracts Views on Vision4Press platform.
Data correspond to usage on the plateform after 2015. The current usage metrics is available 48-96 hours after online publication and is updated daily on week days.
Initial download of the metrics may take a while.