Fig. 7
Download original image
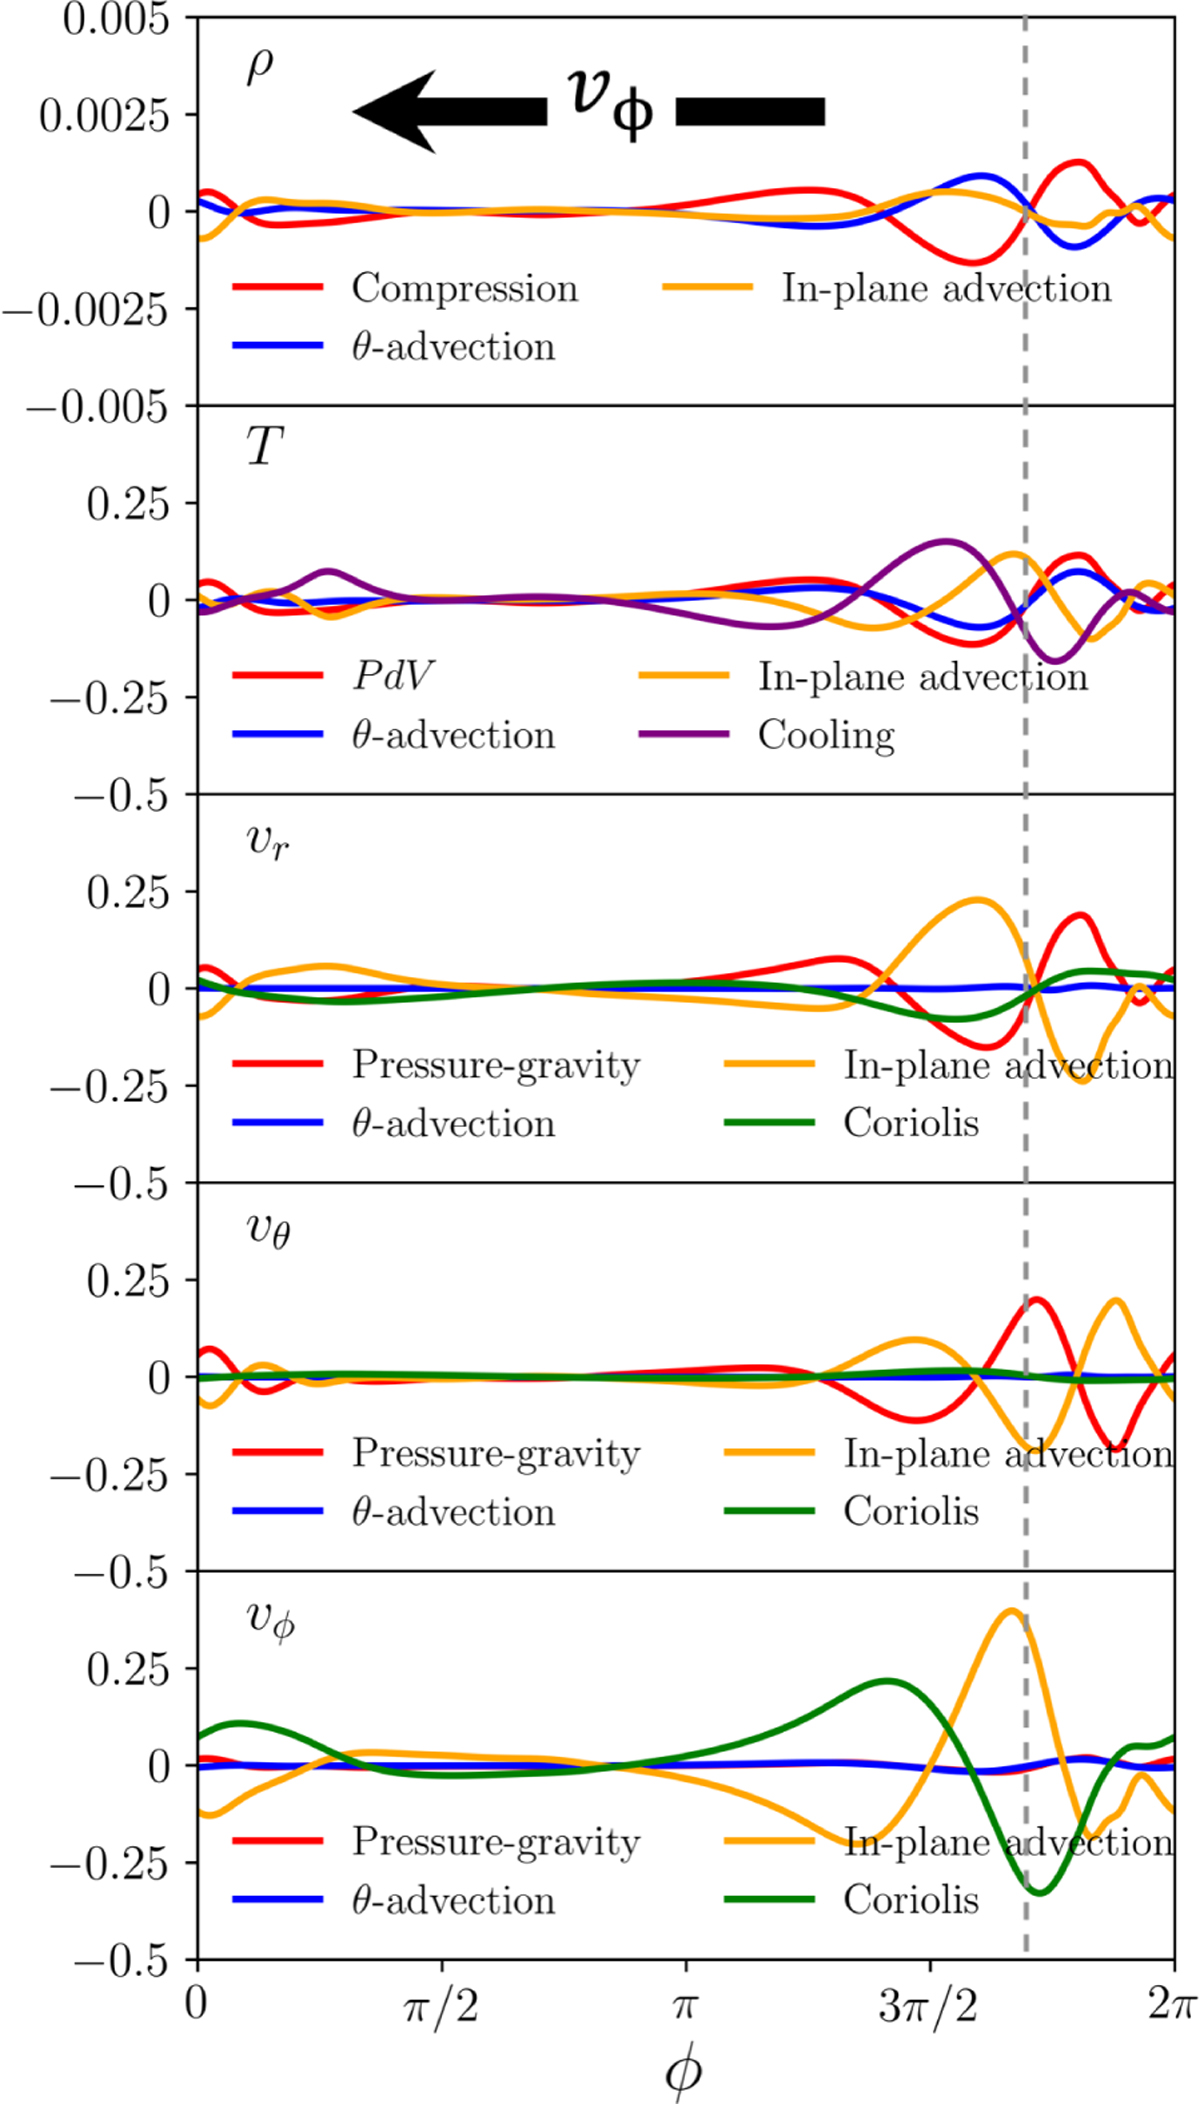
Source (red) and advective (blue) terms at a fixed r = 1.5rp and θ = 0.2, plotted over azimuthal angle ϕ. From top to bottom, we plot these terms for ρ (in units of Ωpρ0,p), Tg (ΩpTg,0,p), υr, υθ, and υϕ (Ωpcs,iso,p), where the p subscript indicates quantities taken at the planet location in the initial condition. A thin dashed gray line passes through the azimuthal peak of the density spiral, showing the significant offset between terms driving spiral perturbations in each quantity.
Current usage metrics show cumulative count of Article Views (full-text article views including HTML views, PDF and ePub downloads, according to the available data) and Abstracts Views on Vision4Press platform.
Data correspond to usage on the plateform after 2015. The current usage metrics is available 48-96 hours after online publication and is updated daily on week days.
Initial download of the metrics may take a while.