Fig. 3
Download original image
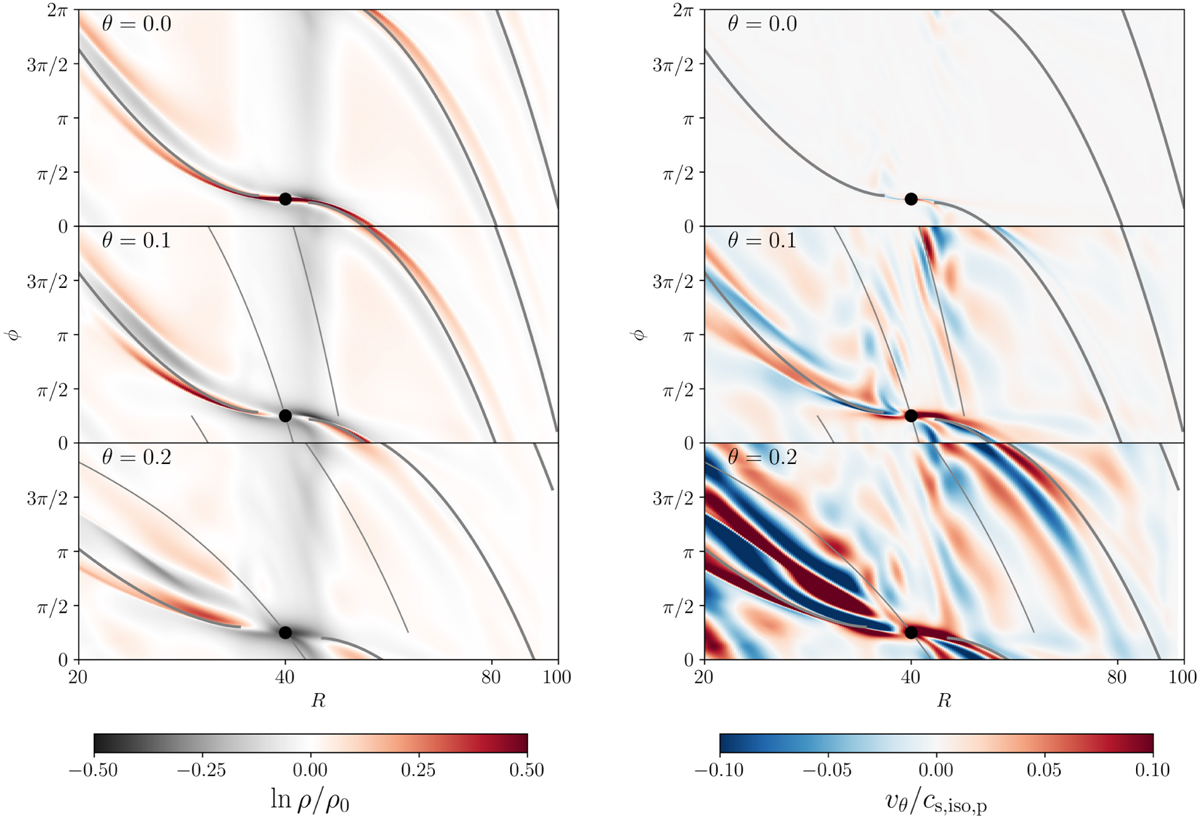
Density, with the planetary spirals indicated (left), and meridional velocity (right) for various altitudes in the disk. Phase predictions for the primary Lindblad arm (Eq. (13), thick line) and m = 3 buoyancy arm (Eq. (15), thin line) are overplotted. In all panels, the cylindrical radius, R = r sin θ, is plotted on the x-axis and the azimuthal angle, θ, on the y-axis. Due to the relatively rapid thermal relaxation in this simulation, buoyancy spirals are markedly weaker than Lindblad spirals in all cases.
Current usage metrics show cumulative count of Article Views (full-text article views including HTML views, PDF and ePub downloads, according to the available data) and Abstracts Views on Vision4Press platform.
Data correspond to usage on the plateform after 2015. The current usage metrics is available 48-96 hours after online publication and is updated daily on week days.
Initial download of the metrics may take a while.