Fig. 1
Download original image
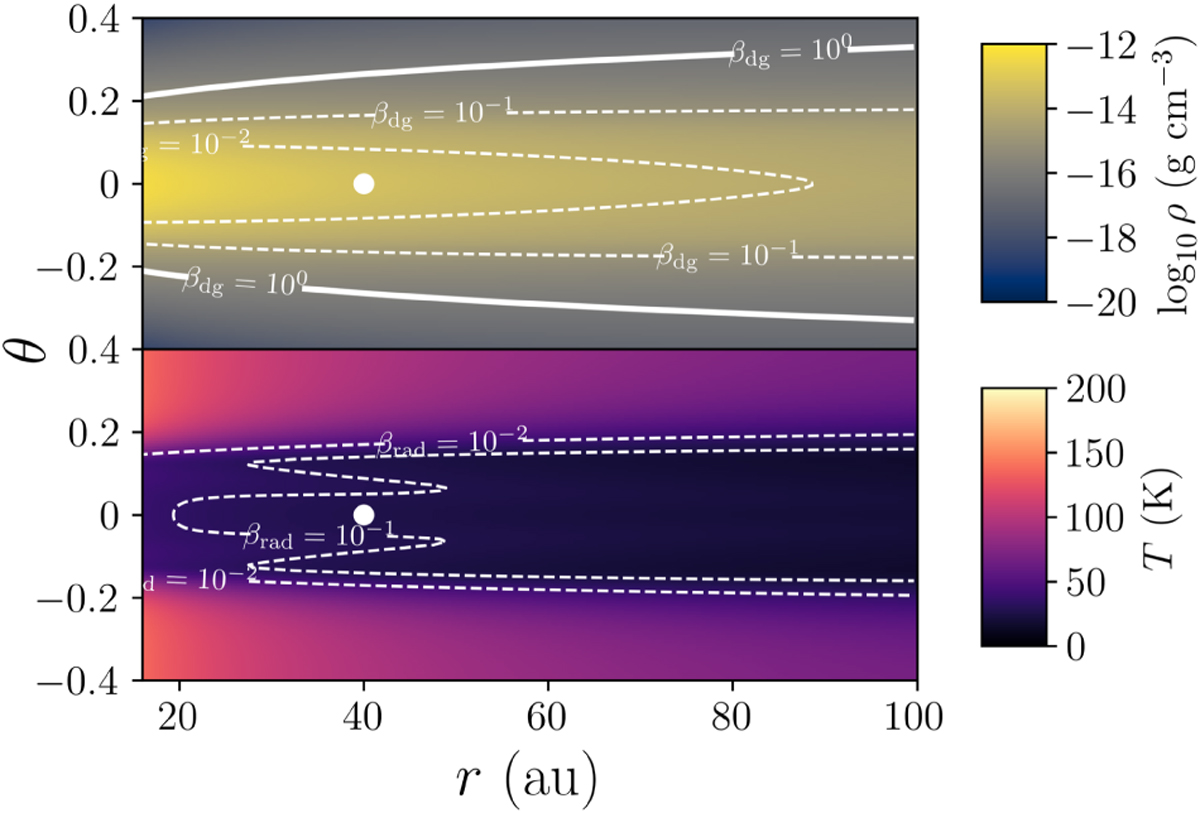
Initial conditions for density (above) and temperature (below), obtained using the iterative procedure described in Sect. 2.3. White lines indicate the corresponding cooling-time contours, computed using Eq. (8). Due to our constant dust-to-gas ratio and assumption of small dust grains throughout the disk, we obtain shorter radiative–diffusion and gas–grain coupling times than in Bae et al. (2021).
Current usage metrics show cumulative count of Article Views (full-text article views including HTML views, PDF and ePub downloads, according to the available data) and Abstracts Views on Vision4Press platform.
Data correspond to usage on the plateform after 2015. The current usage metrics is available 48-96 hours after online publication and is updated daily on week days.
Initial download of the metrics may take a while.