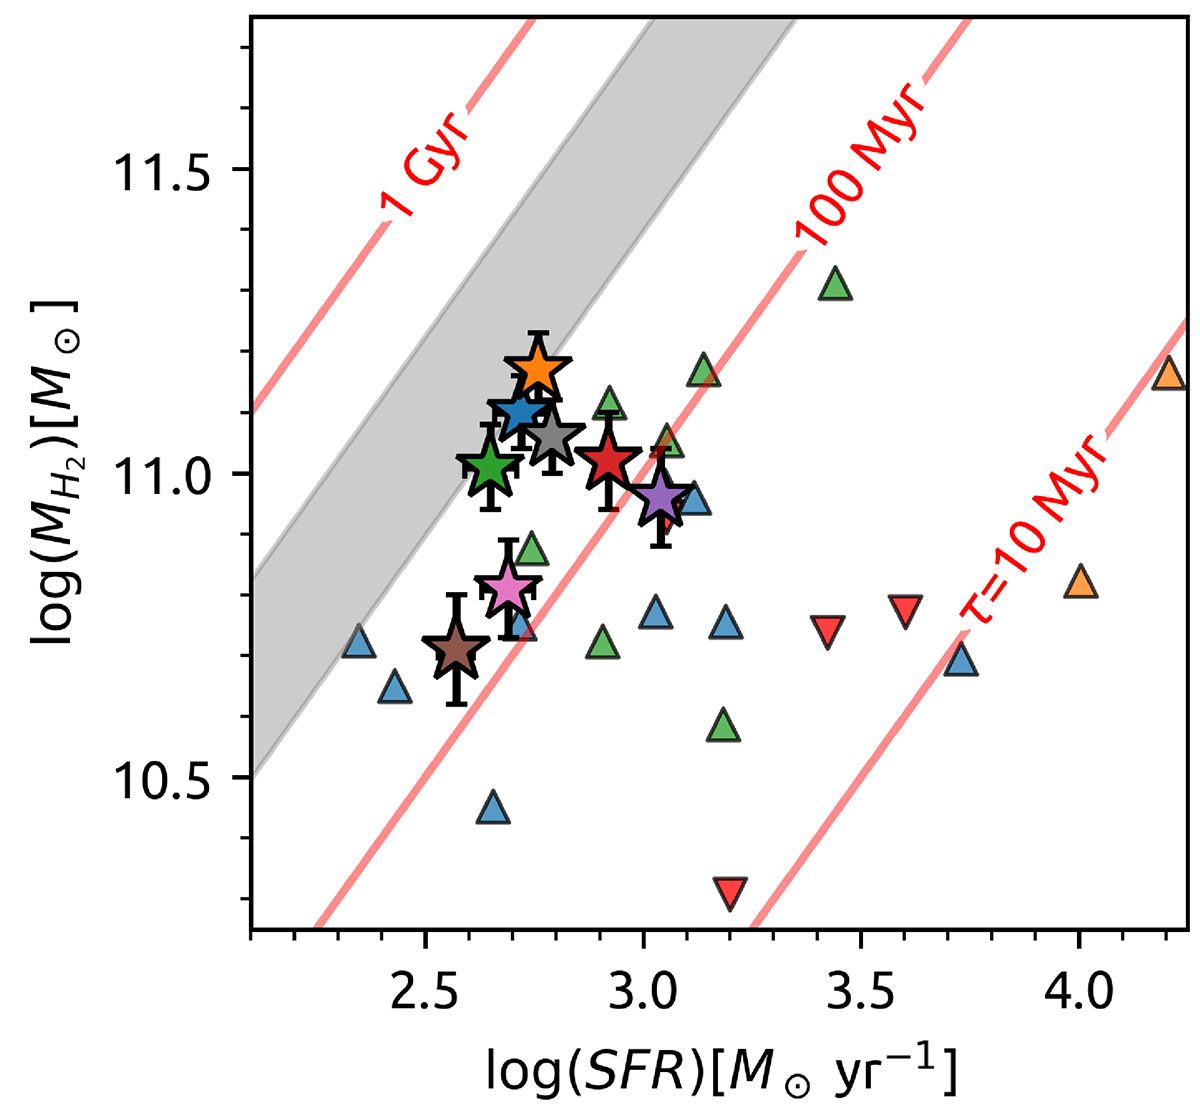
Fig. 8.
Download original image
Depletion time and star formation rate for our targets. The RS NIR-dark galaxies are reported as colored stars, following the same color-code as in Fig. 6. The colored triangles are other populations of SMGs, namely those collected by Bothwell et al. (2017), Cañameras et al. (2018), and Walter et al. (2011), reported in blue, orange, and green, respectively. We also report some confirmed QSOs from the same studies as reversed red triangles. The shaded gray area reports the depletion time expected from main-sequence galaxies at z ∼ 3.5 following the relation τD = 1.5(1 + z)α found by Saintonge et al. (2013), with α spanning from −1.0 (Davé et al. 2012) to −1.5 (Magnelli et al. 2013), rescaled to a Chabrier (2003) IMF.
Current usage metrics show cumulative count of Article Views (full-text article views including HTML views, PDF and ePub downloads, according to the available data) and Abstracts Views on Vision4Press platform.
Data correspond to usage on the plateform after 2015. The current usage metrics is available 48-96 hours after online publication and is updated daily on week days.
Initial download of the metrics may take a while.