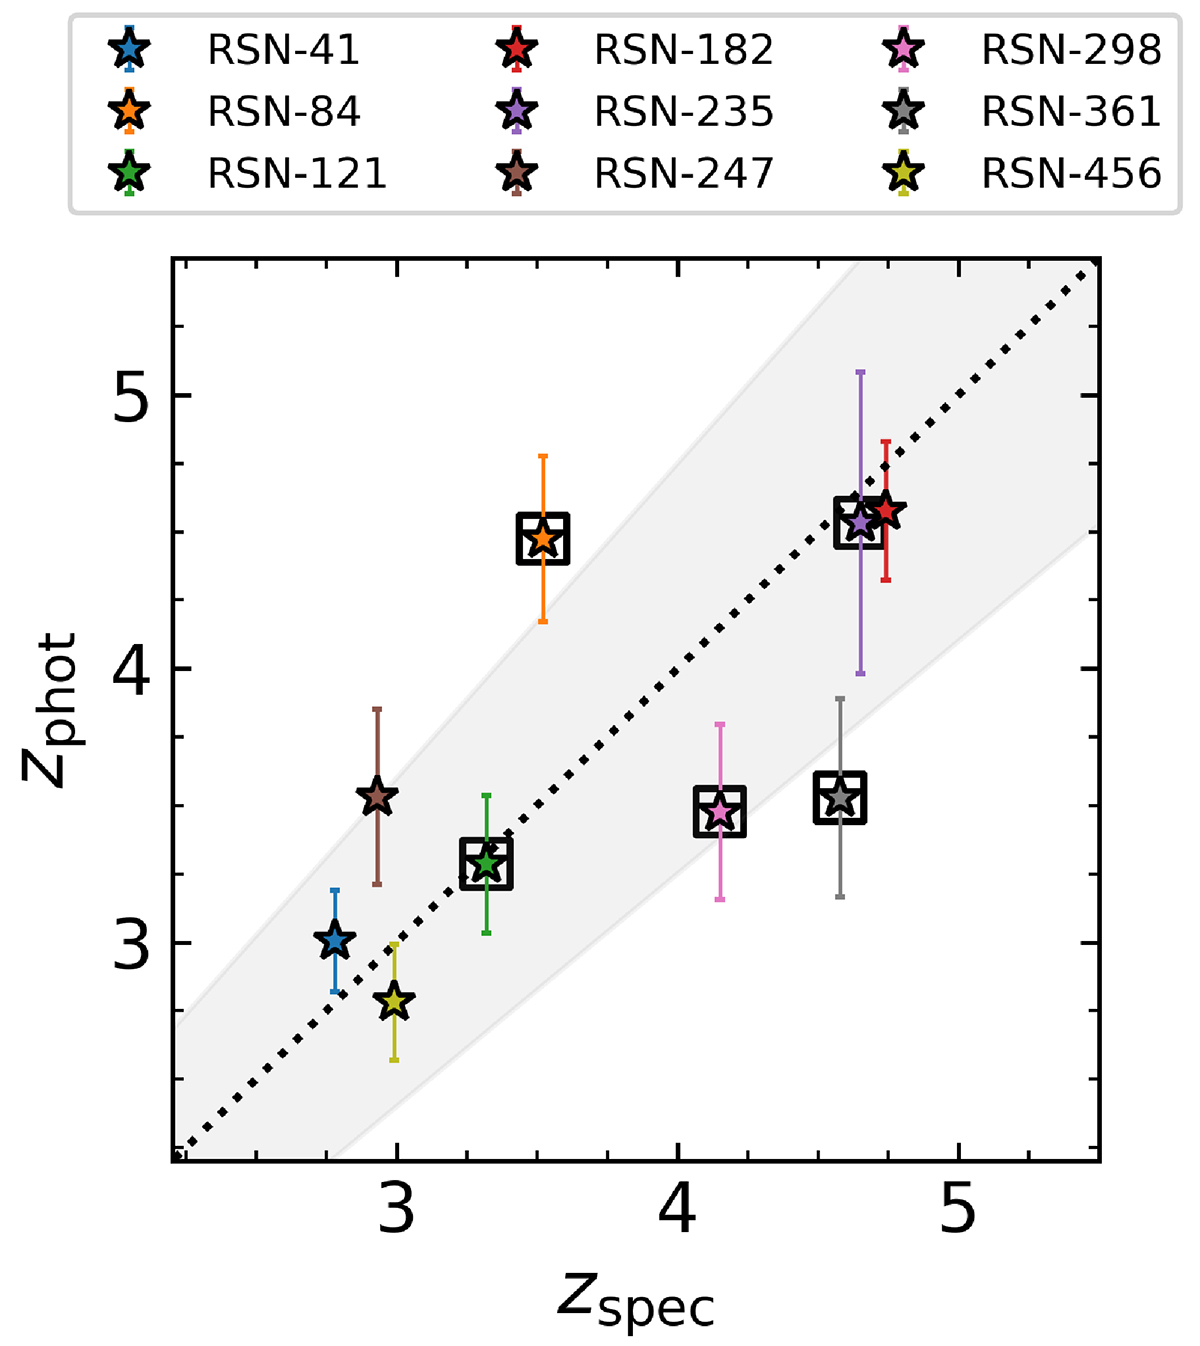
Fig. 6.
Download original image
Comparison of the photometric redshift following Gentile et al. (2024) and the spectroscopic redshifts measured in this study. The one-to-one relation is reported as the dotted black line, and the shaded gray area shows the galaxies with |Δz|/(1 + z) < 0.15. The galaxies with a spec-z obtained from the modeling of two lines are highlighted with an additional box.
Current usage metrics show cumulative count of Article Views (full-text article views including HTML views, PDF and ePub downloads, according to the available data) and Abstracts Views on Vision4Press platform.
Data correspond to usage on the plateform after 2015. The current usage metrics is available 48-96 hours after online publication and is updated daily on week days.
Initial download of the metrics may take a while.