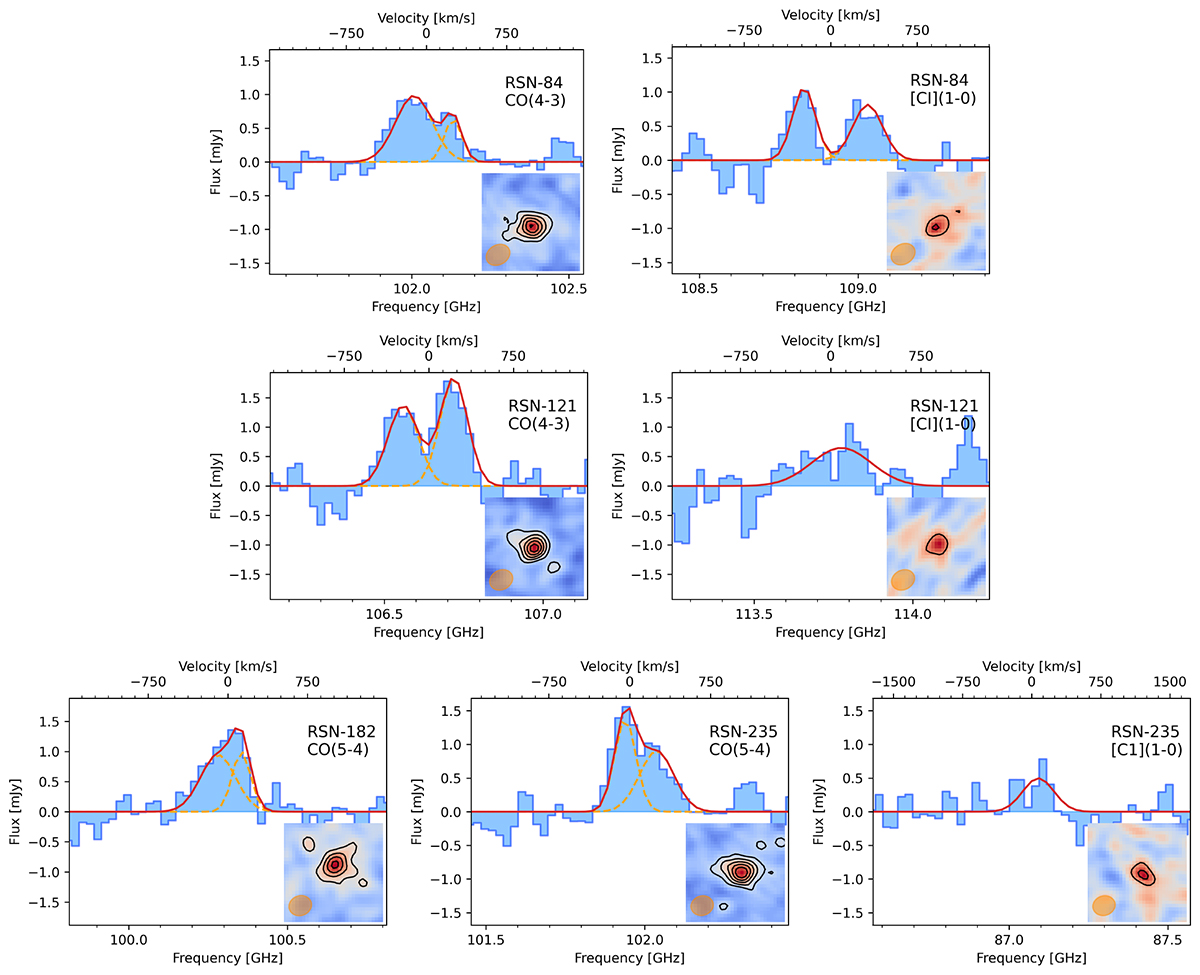
Fig. 3.
Download original image
Spectrum of the various lines identified through the procedure discussed in Sects. 3.2 and 3.3 in our targets. To increase the visibility of the lines, we resampled the original spectral resolution employed in the study up to ∼180 km s−1. For each line, we report in the upper right corner the ID of the galaxy and our modeling as CO or [CI] transitions. The insets show the moment zero of each line (7.5″ side) centered on the radio position measured from the 3 GHz maps, with the contours in steps of 2σ starting from 3σ. In each line, we also report in red the Gaussian modeling with one or two components as described in Sect. 3.4. In the lines modeled with a double Gaussian, we also show the two subcomponents with a dashed orange line.
Current usage metrics show cumulative count of Article Views (full-text article views including HTML views, PDF and ePub downloads, according to the available data) and Abstracts Views on Vision4Press platform.
Data correspond to usage on the plateform after 2015. The current usage metrics is available 48-96 hours after online publication and is updated daily on week days.
Initial download of the metrics may take a while.