Open Access
Fig. 2.
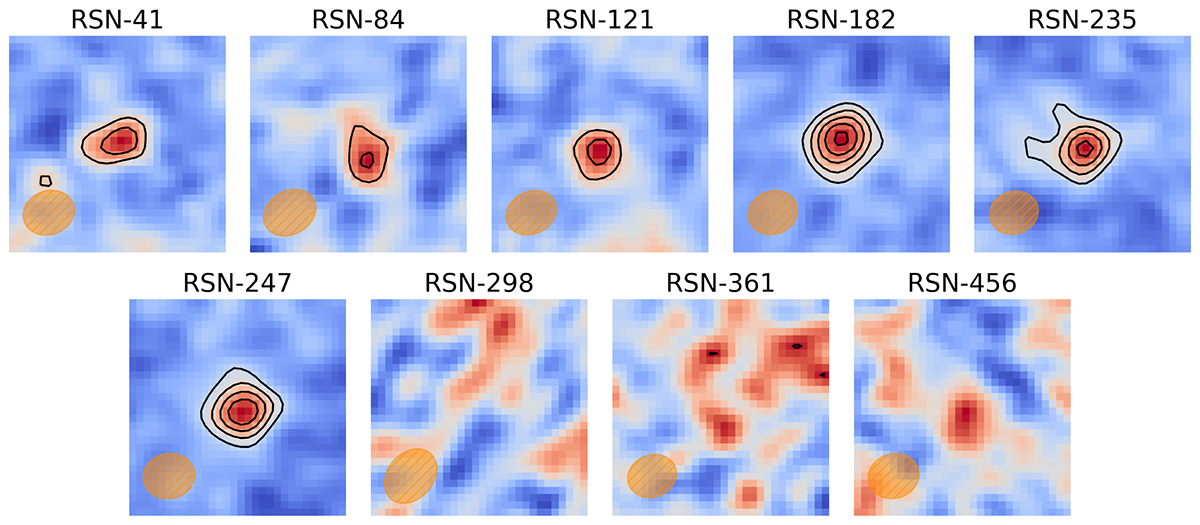
Download original image
Continuum maps of the nine targets. The black contours are in steps of 2σ starting from 3σ. All the images have a 7.5″ side, while the synthetized beam is reported in the lower left corner of each image.
Current usage metrics show cumulative count of Article Views (full-text article views including HTML views, PDF and ePub downloads, according to the available data) and Abstracts Views on Vision4Press platform.
Data correspond to usage on the plateform after 2015. The current usage metrics is available 48-96 hours after online publication and is updated daily on week days.
Initial download of the metrics may take a while.