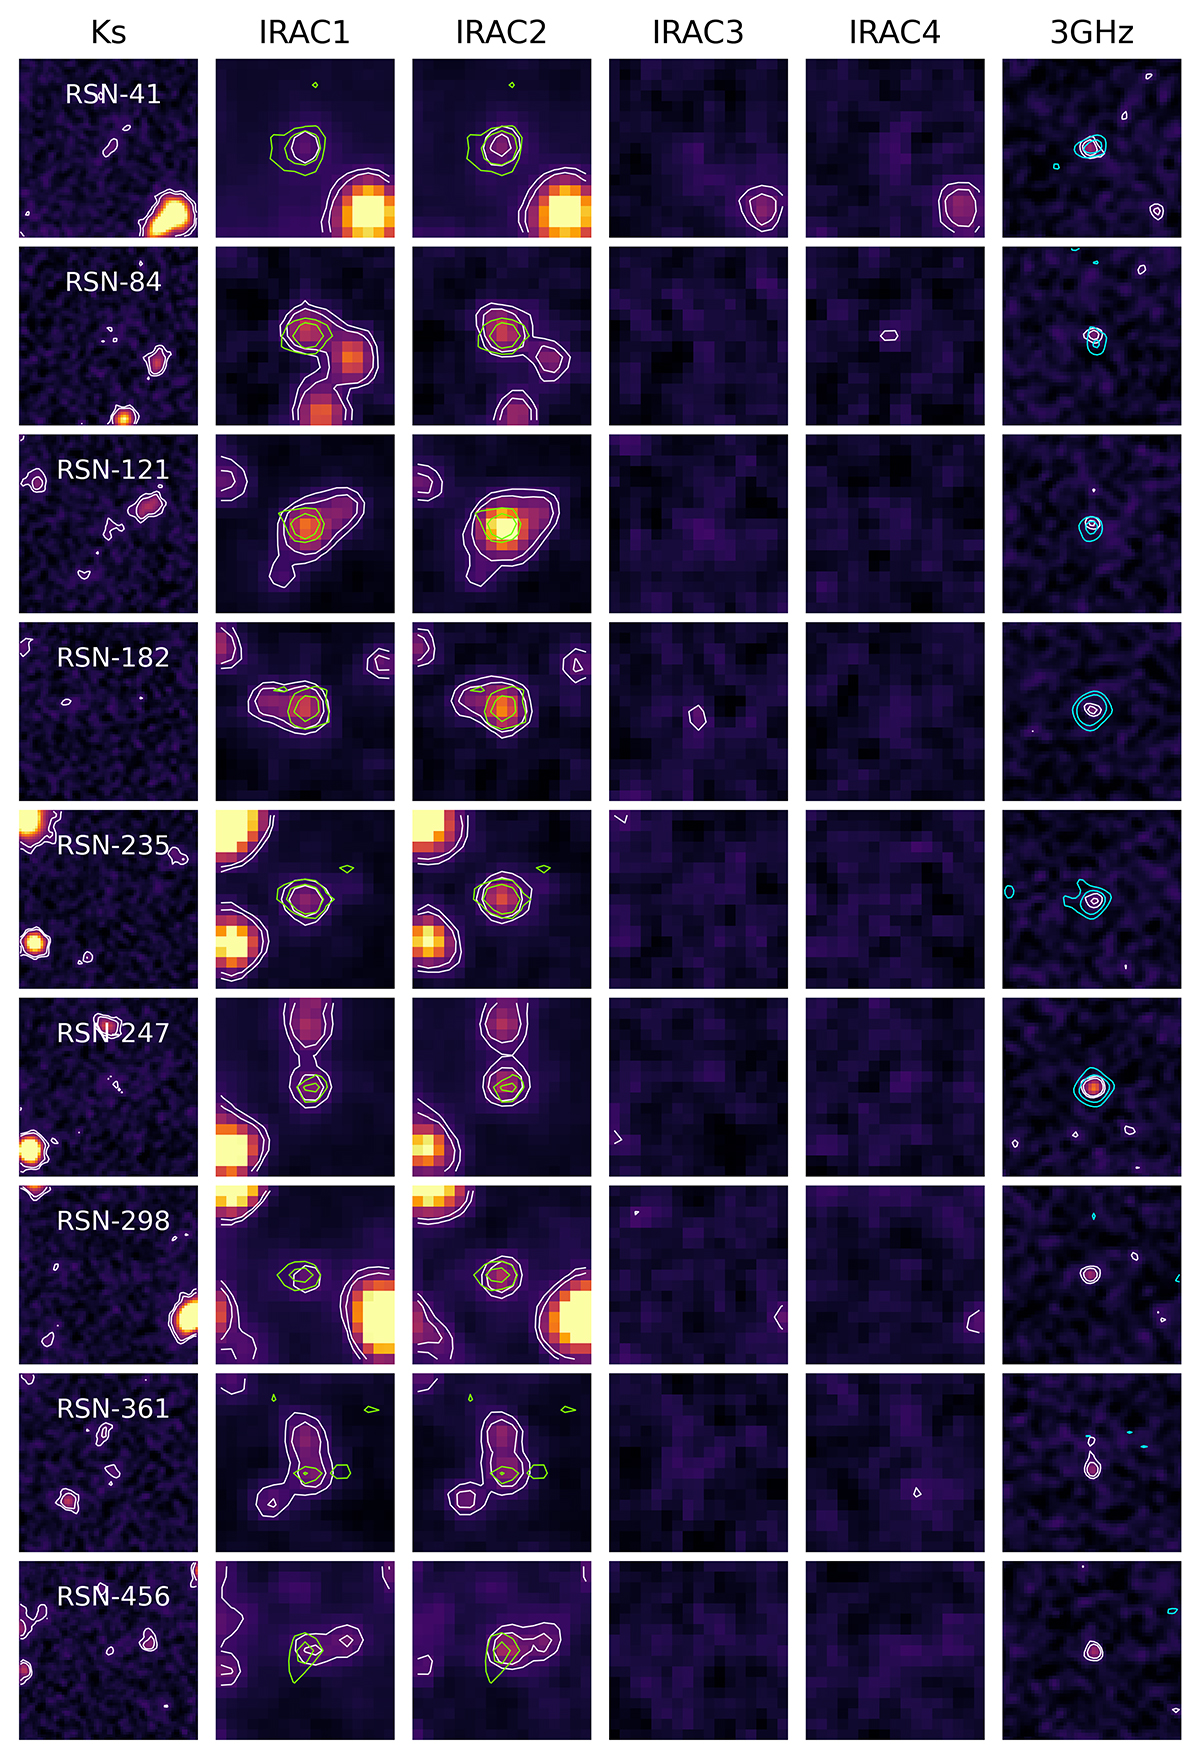
Fig. A.2.
Download original image
Cutouts (10” × 10”) in the main NIR-to-MIR bands for the nine targets. We report the 3 and 5 σ contours. Moreover, for each galaxy, we overplot in green the 3 and 5 σ contours of the brightest line on the IRAC ch1 and ch2 images. Similarly, the same contours of the continuum emission are overplotted in cyan on the 3 GHz images.
Current usage metrics show cumulative count of Article Views (full-text article views including HTML views, PDF and ePub downloads, according to the available data) and Abstracts Views on Vision4Press platform.
Data correspond to usage on the plateform after 2015. The current usage metrics is available 48-96 hours after online publication and is updated daily on week days.
Initial download of the metrics may take a while.