Fig. 4.
Download original image
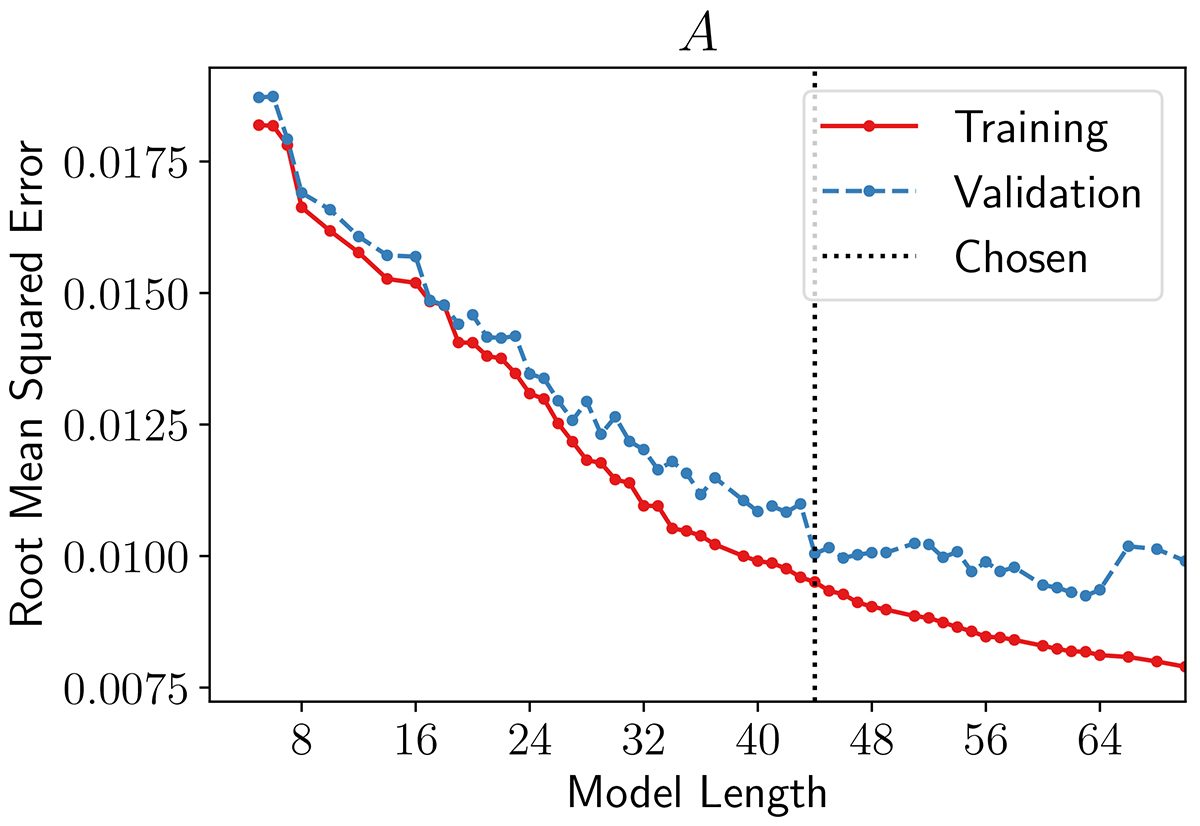
Pareto front of solutions found by OPERON to approximate the difference between the nonlinear matter power spectrum and the prediction of HALOFIT. Each point on the red line represents the function with the best mean squared error on the training set for a given model length, whereas the blue curve shows the same loss for these functions evaluated on the validation set. We choose to use the model of length 44, as indicated by the vertical dotted line.
Current usage metrics show cumulative count of Article Views (full-text article views including HTML views, PDF and ePub downloads, according to the available data) and Abstracts Views on Vision4Press platform.
Data correspond to usage on the plateform after 2015. The current usage metrics is available 48-96 hours after online publication and is updated daily on week days.
Initial download of the metrics may take a while.