Fig. 6.
Download original image
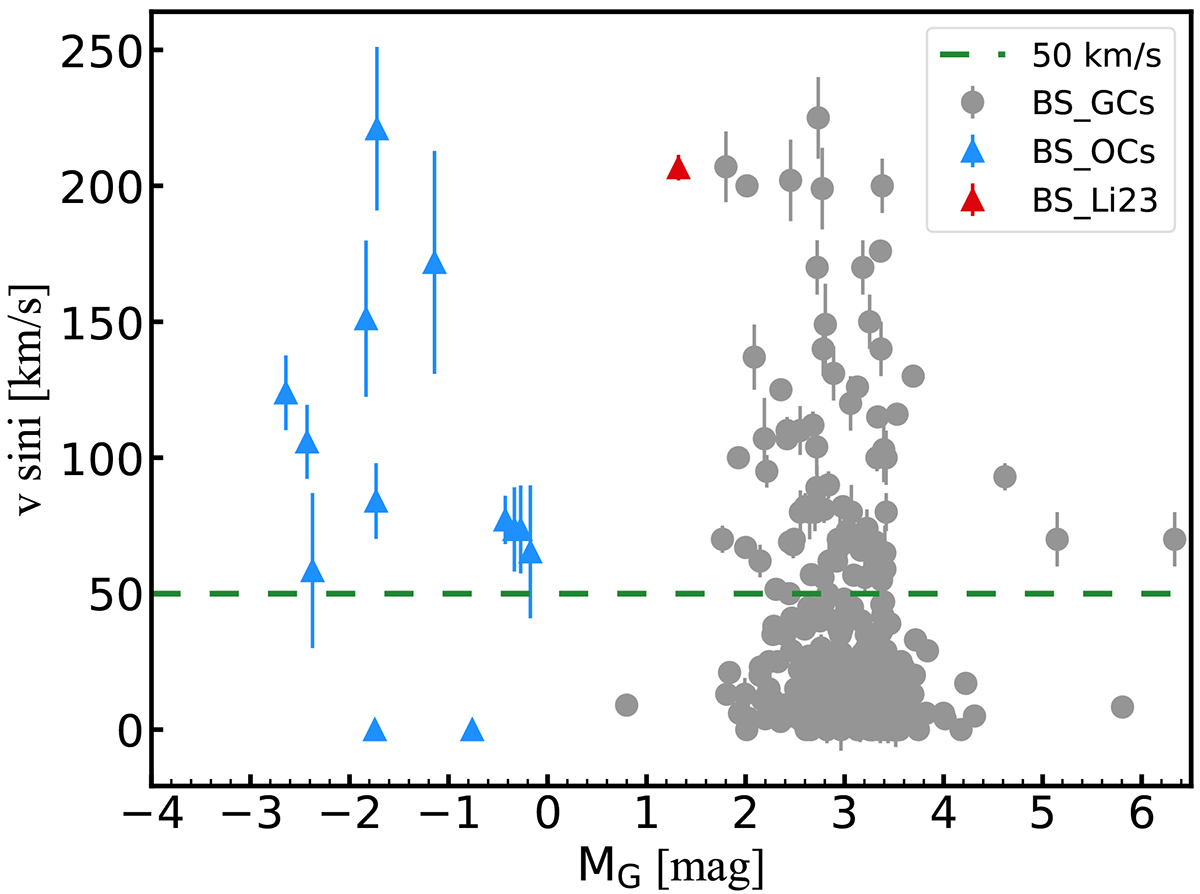
Rotational velocity distributions as a function of absolute G magnitude. The BSSs in OCs reported by Li et al. (2023) are plotted as triangles, while BS_Li23 is marked as a red triangle. BSSs in GCs from Ferraro et al. (2023a) are denoted by gray dots. The v sin i errors for blue triangles, red triangles, and gray dots are from Gaia DR3, Sect. 2.2 of this work, and Ferraro et al. (2023a), respectively. Distance module and reddening for BSSs in GCs are all from the website (https://people.smp.uq.edu.au/HolgerBaumgardt/globular), while those for BSSs in OCs are from Li et al. (2023).
Current usage metrics show cumulative count of Article Views (full-text article views including HTML views, PDF and ePub downloads, according to the available data) and Abstracts Views on Vision4Press platform.
Data correspond to usage on the plateform after 2015. The current usage metrics is available 48-96 hours after online publication and is updated daily on week days.
Initial download of the metrics may take a while.