| Issue |
A&A
Volume 690, October 2024
|
|
|---|---|---|
| Article Number | A156 | |
| Number of page(s) | 9 | |
| Section | Galactic structure, stellar clusters and populations | |
| DOI | https://doi.org/10.1051/0004-6361/202450593 | |
| Published online | 02 October 2024 | |
Rotational velocities of blue straggler stars in the globular cluster M 55★
1
Dipartimento di Fisica e Astronomia, Università degli Studi di Bologna,
Via Gobetti 93/2,
40129
Bologna,
Italy
2
INAF, Osservatorio di Astrofisica e Scienza dello Spazio di Bologna,
Via Gobetti 93/3,
40129
Bologna,
Italy
3
Universidad Andres Bello, Facultad de Ciencias Exactas, Departamento de Ciencias Físicas – Instituto de Astrofisica, Autopista Concepción-Talcahuano,
7100
Talcahuano,
Chile
★★ Corresponding author; This email address is being protected from spambots. You need JavaScript enabled to view it.
Received:
2
May
2024
Accepted:
5
August
2024
Abstract
By using high-resolution spectra acquired with FLAMES-GIRAFFE at the ESO/VLT, we measured the radial and rotational velocities of 115 stars in the Galactic globular cluster M 55. After field decontamination based on the radial velocity values, the final sample of member stars is composed of 32 blue straggler stars (BSSs) and 76 reference stars populating the red giant and horizontal branches of the cluster. In agreement with previous findings, the totality of red giant branch stars has negligible rotation (<10 km s−1) and horizontal branch stars have rotational velocities of 40 km s−1 at most. In contrast, the BSS rotational velocity distribution shows a long tail extending up to ~200 km s−1, with 15 BSSs (out of 32), spinning faster than 40 km s−1. By defining the threshold for fast rotating BSSs at 40 km s−1, this sets the percentage of these stars at 47 ±14%. Such a large value has never been found before in any globular clusters. It is roughly comparable to that measured in other loose systems (ω Centauri, M 4, and NGC 3201) and significantly larger than that observed in high-density clusters (as 47 Tucanae, NGC 6397, NGC 6752, and M 30). This evidence supports a scenario whereby recent BSS formation is occurring in low-density environments. We also find that the BSS rotational velocity tends to decrease for decreasing luminosity, as found for another loose cluster of the sample, namely, NGC 3201.
Key words: techniques: spectroscopic / blue stragglers / globular clusters: general
Based on observations collected at the European Southern Observatory, Cerro Paranal (Chile), under Program 093.D-0270 (PI: Lovisi).
© The Authors 2024
 Open Access article, published by EDP Sciences, under the terms of the Creative Commons Attribution License (https://creativecommons.org/licenses/by/4.0), which permits unrestricted use, distribution, and reproduction in any medium, provided the original work is properly cited.
This article is published in open access under the Subscribe to Open model. This email address is being protected from spambots. You need JavaScript enabled to view it. to support open access publication.
1 Introduction
Blue straggler stars (BSSs) are an “exotic” stellar population that has not been predicted within the framework of standard stellar evolution theory. In the color-magnitude diagram (CMD) of Galactic globular clusters (GCs), they lie on a bluer (hotter) and brighter extension of the main sequence (MS; see, e.g., Ferraro et al. 1992, 1997, 2001, 2003), where stars more massive (M ∼ 1.2–1.6 M⊙; Shara et al. 1997; Gilliland et al. 1998; De Marco et al. 2005; Fiorentino et al. 2014; Raso et al. 2019) than normal MS turnoff stars (with M ∼ 0.8 M⊙) spend their core hydrogen-burning phase. Due to their large mass, BSSs are crucial gravitational test particles to probe internal dynamical processes occurring in GCs. Ferraro et al. 2012 proposed the concept of a “dynamical clock”, which is a method based on the analysis of the BSS radial distribution to infer the level of dynamical evolution of star clusters. In this respect, the  parameter (Alessandrini et al. 2016; Lanzoni et al. 2016) measures the degree of BSS central segregation with respect to a lighter reference population (typically red giant branch, RGB, or MS stars) adopted as a reference. This parameter has been found to efficiently trace the level of dynamical evolution that star clusters undergo (Ferraro et al. 2018, 2019, 2020, 2023a).
Two main scenarios for BSS formation have been suggested so far: 1) mass transfer (MT) activity in binary systems (McCrea 1964), where the companion star transfers mass and angular momentum to the accreting proto-BSS that then becomes a MT-BSS; and 2) direct collisions between two or more stars, producing collisional BSSs (COL-BSSs; Hills & Day 1976). The frequency of both formation channels can, in principle, be increased by mergers or collisions produced by the evolution of triple systems (Andronov et al. 2006; Perets & Fabrycky 2009). To shed light on the formation and the evolutionary processes of this class of exotica, several studies have been carried out in both open and globular clusters, searching for evidence of the two formation channels and possible links between the observational properties of BSSs and those of the host parent cluster (e.g., Ferraro et al. 1993, 1995; Davies et al. 2004; Piotto et al. 2004; Sollima et al. 2008; Mathieu & Geller 2009; Geller & Mathieu 2011; Gosnell et al. 2014; Leigh et al. 2007, 2013).
Since MT-BSSs are produced by binary systems, this formation channel should be favored in low-density environments because, in conditions of high stellar crowding, binary systems are subject to multiple dynamical interactions that can disrupt them. Indeed, promising evidence of MT-BSSs has been found from both photometric and spectroscopic studies in low-density environments, such as loose GCs and open clusters. By analyzing Hubble Space Telescope (HST) photometric data of a sample of loose Galactic GCs, Sollima et al. 2008 found a positive correlation between the fraction of binary systems and that of BSSs, in agreement with what is expected if MT activity in binaries is indeed the main BSS formation channel. Moreover, an ultraviolet (UV) excess has been detected (Gosnell et al. 2014, 2015) in a few BSSs in the open cluster NGC 188, a stellar system with a very large fraction of BSSs in binary systems (Mathieu & Geller 2009). This has been interpreted as evidence of the presence of a hot white dwarf (the remnant core of the original donor star at the end of the MT phase) orbiting a newly formed BSS. From the chemical point of view, MT-BSSs are predicted to show anomalous surface abundances of carbon, nitrogen, and oxygen, due to material that has been partially processed by the CNO burning cycle in the innermost layers of the donor star becoming accumulated onto the BSS surface (Sarna & De Greve 1996). Conversely, COL-BSSs are expected to show normal chemical abundances (Lombardi et al. 1995). A sub-sample of BSSs with carbon and oxygen depletion (the expected MT formation signature) has indeed been found both in 47 Tucanae (Ferraro et al. 2006) and in M 30 (Lovisi et al. 2013b). Similarly, an enhancement in barium (Milliman et al. 2015; Nine et al. 2024) has been found in a few BSS in open clusters and interpreted as a signature of mass transfer from an asymptotic giant branch companion onto a proto-BSS.
A potential manifestation of COL-BSS comes from the photometric investigation of post-core collapse GCs. In fact, during the core collapse phase, the central density increases significantly, and this can trigger an enhancement of the collisional activity that contributes to the formation of COL-BSSs. Thus, the presence of a relatively new and coeval population of COL- BSSs with different masses is expected to be observable in stellar systems that experienced core collapse in their recent past. In accordance with this, the narrow blue sequence of BSSs, which appears to be well separated from a redder BSS sequence in the CMD of a few post-core collapse GCs (i.e., M 30, NGC 362, M 15, and NGC 6256; see Ferraro et al. 2009; Dalessandro et al. 2013; Beccari et al. 2019; Cadelano et al. 2022) has been interpreted as due to a population of COL-BSSs that were recently formed during the core collapse event.
Instead, the rotational velocity does to seem to not allow us to distinguish between MT- and COL-BSSs. In fact, large rotational velocities are expected at birth for BSSs formed by both the channels, due to the transfer of mass and angular momentum for MT-BSSs (Packet 1981; Sarna & De Greve 1996; de Mink et al. 2013), as well as to the conservation of angular momentum for COL-BSSs (Benz & Hills 1987; Sills et al. 2002). However, braking mechanisms (e.g., magnetic braking and disk locking) are predicted to slow down the rotation of these stars as function of time (Leonard & Livio 1995; Sills et al. 2005; Leiner et al. 2018; Sun et al. 2024). The characteristic timescales of these processes are still largely unknown and any new observational constraint is precious in this respect. Thus, although the rotational velocity cannot be used as a diagnostic of the formation mechanism, it could be an indicator of the BSS age (i.e., the amount of time passed from the end of MT, or from the collision that originated the BSS), providing new physical information to inform a more comprehensive modeling of these objects.
In this context, several years ago our group started an high-resolution spectroscopic survey aimed at the chemical and kinematical characterization of BSSs belonging to GCs with different structural properties. Eight GCs have been observed so far: 47 Tucanae (Ferraro et al. 2006), NGC 6397 (Lovisi et al. 2012), NGC 6752 (Lovisi et al. 2013a), M 30 (Lovisi et al. 2013b), M 4 (Lovisi et al. 2010), ω Centauri (Mucciarelli et al. 2014), NGC 3201 (Billi et al. 2023), and M 55 (this paper). Using this dataset, Ferraro et al. 2023b found intriguing relations between the fraction of fast-rotating (FR) BSSs and the parent cluster structural parameters (such as central density and concentration), suggesting that rapidly spinning BSSs preferentially populate low-density environments. According to Ferraro et al. 2023b, FR-BSSs have been defined as those with projected rotational velocity υ sin(i) ≥ 40 km s−1, with i being the inclination angle on the plane of the sky. In that paper, we analyzed the overall distribution of rotational velocities in a sample of 300 BSSs in eight clusters, finding that it shows a significant drop at values larger than 30–50 km/s, thus suggesting an appropriate threshold value of 40 km/s. We also showed that the assumption of a slightly different threshold value does not affect the results. Among the investigated clusters, M 55 is the one with the lowest values of central density (log ρ0 = 2.2 in units of L⊙ pc−3) and concentration parameter (c = 0.93). This paper is devoted to the detailed presentation and discussion of the results obtained for the BSSs and the reference horizontal branch (HB) and RGB stars observed in M 55. We organized the paper into the following sections. The observations and data reduction are discussed in Sect. 2. The radial velocities measures and the determination of the atmospheric parameters for the cluster member stars are described in Sects. 3 and 4, respectively. The determination of rotational velocities is presented in Sect. 5. In Sect. 6, we describe the obtained results and our conclusions.
2 Observations
This work is based on high resolution stellar spectra acquired with the multi-object spectrograph FLAMES-GIRAFFE (Pasquini et al. 2002) mounted at the Very Large Telescope of European Southern Observatory (ESO) under program 093.D- 0270 (PI: Lovisi). All spectra have been acquired with the HR2 grating, with a spectral resolution R = 22 700 in the wavelength range Δλ = 3854–4049Å, in order to sample the Ca II K line at the wavelength λ = 3933.663Å, which is very sensitive to the rotation of stars at high temperature (BSS and HB). For RGBs, we used different lines of Fe and Ti. A total of 16 exposures of 2760 seconds each have been secured. The observations have been performed in nine nights between June and July 2014. Six exposures had bad sky conditions (moon distance and airmass) so we excluded them from the analysis. The spectra have been acquired for 115 targets selected along the HB, the RGB, and the BSS sequence in the UV and optical CMDs presented in Lanzoni et al. (2007). The standard pre-reduction steps (bias subtraction, flat field correction, wavelength calibration, and the one-dimensional spectra extraction) have been performed using the dedicated ESO pipeline1. The sky contribution has been subtracted from the observed spectra by using a master-sky spectrum obtained as the median of all the sky spectra of each exposure. Then, the sky-subtracted and heliocentric velocity- corrected spectra of each target were combined together. The S/N values for the BSS sample ranges between 15 and 30. Instead, the S/N for HBs and RGBs ranges between 25–70 and 15–70, respectively.
3 Radial velocities and cluster membership
The radial velocities (Vr) of the sampled stars have been measured by using the IRAF task, fxcor, which performs a cross-correlation between the observed spectrum and a template spectrum of known Vr (Tonry & Davis 1979). As templates we adopted synthetic spectra computed with the code SYN- THE (Sbordone et al. 2004; Kurucz 2005) for BSSs, HB, and RGB stars, to take into account their different stellar parameters and the different line strengths. The last version of the Kurucz/Castelli linelist for atomic and molecular transitions has been adopted. We calculated the model atmospheres for the synthetic spectra with the ATLAS9 code (Kurucz 1993; Sbordone et al. 2004) under the assumptions of local thermodynamic equilibrium (LTE) and plane-parallel geometry, and adopting the opacity distribution functions by Castelli & Kurucz (2003) with no inclusion of the approximate overshooting prescription (Castelli et al. 1997).
Figure 1 shows the distribution of the measured Vr of the 115 targets as a function of the distance from the cluster center. The vast majority of the targets defines a narrow distribution strongly peaked at the systemic velocity of the cluster. The mean value and the standard deviation of the mean obtained from our sample turn out to be 175.1 ± 0.5 km s−1, while the standard deviation of the sample is σ = 5.2 km s−1, and nicely agrees with the systemic velocity quoted in Baumgardt & Hilker 2018 (⟨Vr⟩ = 174.8 ± 0.2 km s−1 ). Such a narrow distribution allows for a straightforward identification of the few field stars contaminating the observed sample: indeed, only seven targets (corresponding to 6% of the total sample) display much smaller radial velocities (well below ⟨Vr⟩ = 50 km s−1) and can thus be safely considered as field interlopers (gray circles in Fig. 1). Thus, we considered as member stars those within 3σ from the cluster systemic velocity. Only one star (namely #2700733) is marginally consistent with this assumption within the errors. Because this is a fast rotator, the measure of its radial velocity turns out to be more uncertain than the others (see Table 1). However (as shown in Fig. 1), the mean radial velocity of field stars in this region of the sky (⟨Vr⟩ = −23.1 ± 18.5 km s−1) is very different from that of the cluster (⟨Vr⟩ = 175 km s−1). Hence, the probability that this star is a field interloper is very low. Moreover, its proper motion (from Gaia DR3) turns out to be fully consistent with that of the cluster, thus further confirming its membership. In summary, our sample of likely cluster members include 32 BSSs, 30 RGBs, and 46 HB stars. The 32 surveyed BSSs are a representative sub-sample of the entire population, which in this cluster counts 55–58 objects. In addition, they have been selected to secure adequate sampling of both the luminosity extension of the BSS sequence and the BSS radial distribution. Also the HB sample can be considered representative, since it covers the entire distribution in color (temperature) of the HB evolutionary stage. On the other hand, the few observed RGB stars are just meant to provide a reference population of slow rotators. The most relevant criterium adopted for the target selection is to avoid contamination of the spectra from scattered light from close neighbors. Hence, all the potential targets having stars of comparable or brighter luminosity within a distance of about 3″ (which is more than twice the spectroscopic fiber size) have been excluded from the selection. For the sake of illustration, Fig. 2 shows their position in the (B, B − I) CMD obtained from ground-based photometry (Stetson et al. 2019).
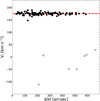 |
Fig. 1 Radial velocity distribution, as a function of the distance from the cluster center, obtained from the acquired spectra. The black and gray circles correspond to cluster members and Galactic field interlopers, respectively. The red dashed line marks the average radial velocity of the member star sample. |
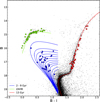 |
Fig. 2 CMD of M 55 (black dots) with the surveyed BSS, RGB and HB stars marked, respectively, as blue, red, and green circles. A set of BASTI isochrones (Pietrinferni et al. 2021) with ages ranging from 2 to 9 Gyr are overplotted as blue lines, a BASTI isochrone of 13 Gyr is overplotted as red line, and a BASTI HB model is overplotted as green line. |
4 Atmospheric parameters
The values of effective temperature (Teff) and surface gravity (log 𝑔) of the spectroscopic targets, have been estimated from the comparison of their positions in the CMD with reference theoretical models. We used isochrones and HB models from the BASTI-IAC database (Pietrinferni et al. 2021), adopting an α-enhanced mixture and a metallicity [Fe/H]= −1.94 dex (Harris 1996). To transform the models into the observational CMD, we adopted the distance modulus quoted in Harris (1996) and then applied a slightly larger value of the reddening, E(B −V) = 0.11 mag, instead of E(B − V) = 0.08 (as quoted in Harris (1996)), to optimize the match between the models and the data. We used an HB model with masses ranging from 0.5 M⊙ to 0.75 M⊙ , a 13 Gyr-old isochrone (according to the age estimate by VandenBerg et al. 2013; we note that adopting a slightly younger age has a negligible impact on the temperature and gravity determination) aptly reproducing the RGB location and a set of isochrones with ages ranging from 2 Gyr to 9 Gyr. This allows us to properly sample the BSS region of the CMD (see solid lines in Fig. 2). Each spectroscopic target has been orthogonally projected on the closest model and the corresponding temperature and gravity have been associated. The resulting values of Tmeff and log g range between 7500–13 400 K and 3.0– 4.1 dex, respectively, for the HB stars, while for the RGB targets we find ΔTeff = 4800-5400 K and Δ log 𝑔 = 1.7–3.3 dex; for the surveyed BSS sample, we obtained ΔTeff = 6800-9700 K and Δ log 𝑔 = 3.6–4.3 dex. Finally, a microturbulence of 1 km s-1 has been assumed for BSSs and HB stars, while 1.5 km s-1 has been used for the RGB sample, which are typical values for stars with such temperatures and surface gravities. We note that varying this parameter has a negligible impact on the derived rotational velocities.
Properties of the analyzed BSSs.
5 Rotational velocities
The rotational velocities projected on the line of sight (v sin(i)) have been determined from the comparison between each observed spectrum and a grid of synthetic spectra computed with the atmospheric parameters appropriate for the star under consideration, as well as different rotational velocities; a χ2 minimization procedure then finds the most appropriate value of υ sin(i) needed to reproduce the observations. This has been done in the spectral region around the Ca II K absorption line at λ = 3933.663Å. For the sake of illustration, Fig. 3 shows the comparison between the observed and the synthetic spectra of two BSSs with different rotational velocities. As can be appreciated, a large value of υ sin(i) causes a large broadening of the line width2. For very slowly rotating BSSs, we assume an upper limit of 3 km s−1 for their v sin(i) value, because this is the typical uncertainty obtained from the Monte Carlo simulations for these objects.
The uncertainties in the rotational velocities obtained with this procedure were estimated by using Monte Carlo simulations: a simulated spectrum with the same S/N of the observed one has been obtained by randomly adding Poisson noise to the bestfitting synthetic template, while its rotational velocity has been determined with the same procedure applied to the data. After 300 realizations of such realistic simulated spectra, the standard deviation of the derived υ sin(i) distribution was adopted as a 1σ uncertainty in the rotational velocity of each star. The estimated uncertainties range from a few (2–5) km s−1 for slowly rotating stars, up to 10–15 km s-1 for the fast-spinning targets.
Figure 4 shows the comparison of the rotational velocity distributions obtained for the reference populations (RGB and HB stars) and the BSS sample. All RGB stars are consistent with null or very slow rotation (v sin(i) < 10 km s−1), while the HB targets show intermediate rotational velocity values, always smaller than 40 km s−1 . The distribution found for BSSs is instead much broader, with a tail extending up to rotational velocities of ∼200 km s−1. Assuming the same definition of FR stars provided by Ferraro et al. 2023b (i.e., stars with rotational velocity ≥40 km s−1 ), we conclude that the fraction of FR objects is zero in both the reference (RGB and HB) samples, while it rises to ∼47 ± 14% (15/32) for the BSS population. This is the largest fraction of FR BSSs ever detected in a GC. This result is discussed in Sect. 6.
Figure 5 shows a zoom in the HB region of the CMD, with different markers corresponding to stars spinning faster and slower than 20 km s−1 (see the legend). With the exception of just one object (out of 13), the HB stars showing large υ sin(i) were found to be located in the redder part of the sequence, at (B −I) > 0.2. At bluer colors, only slowly rotating HB stars were found. A decrease of υ sin(i) for increasing effective temperature in HB stars has been already observed in other GCs, for instance in M 13,M 15, and NGC 6397 (Behr et al. 2000b; Behr et al. 2000a; Lovisi et al. 2012), but the physical mechanism that reduces the rotation in hot HB stars is not fully understood yet. Sills & Pinsonneault (2000) suggested that this might be due to the onset of gravitational settling mechanisms. The strong gradient in the element abundances can suppress the angular momentum transport and this prevents the stars from having a high υ sin(i). Vink & Cassisi (2002) argued that the decrease in rotational velocity for HBs hotter than 11 000 K is due to a loss of angular momentum caused by stellar winds set up by the radiative levitation.
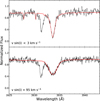 |
Fig. 3 Comparison between the observed spectra (black lines) and the synthetic spectra (red lines) of two BSSs with different rotational velocities (see labels). |
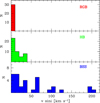 |
Fig. 4 Rotational velocity distributions of RGB stars (top panel), HB stars (middle panel), and BSSs (bottom panel). |
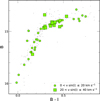 |
Fig. 5 HB region of the CMD of M 55 with the observed stars highlighted with different markers: small green circles for HB stars with υ sin(i) < 20 km s−1, large green squares for those rotating faster (up to 40 km s−1). |
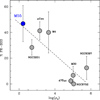 |
Fig. 6 Percentage of FR-BSSs as a function of the central density of the parent cluster, for the systems studied in Ferraro et al. (2023b). The position of M 55 is highlighted in blue. |
6 Discussion and conclusions
This work presents the results of our study about the rotational velocities of BSSs in the Galactic GC M 55. As shown in Fig. 4, while the reference (RGB and HB) stars are all slow rotators, with values of υ sin(i) below the threshold of 40 km s−1, the BSS rotational velocity distribution shows a more complex distribution with a long tail, extending up to ∼200 km s−1 at high values. This distribution is similar to those found in M 4 (Lovisi et al. 2010), ω Centauri (Mucciarelli et al. 2014), and NGC 3201 (Billi et al. 2023). All these clusters are part of the sample studied in Ferraro et al. (2023b), where a significant anti-correlation has been found between the fraction of FR-BSSs and some structural and dynamical parameters of the parent cluster (such as the central density and the concentration parameter). In Fig. 6, we report the behavior of the percentage of FR-BSSs as a function of the parent cluster central density, with M 55 highlighted in blue. As can be seen, this is the system with the largest fraction of FR-BSSs and the smallest central density in the sample of GCs investigated so far.
Figure 7 shows the location of the measured BSSs in the CMD, plotted as circles of different sizes and colors depending on their rotational velocity. The slowly rotating BSSs (with υ sin(i) <40 km s−1) are plotted as small blue circles, while FR- BSSs are increasingly larger circles with orange color for υ sin(i) between 40 and 80 km s−1, red color for rotational velocities ranging from 80 to 180 km s−1, and violet color for the high- rotation tail, with υ sin(i) ≥ 180 km s−1. We also checked our BSS sample for variability, performing a cross-correlation with the catalog of Kaluzny et al. (2010) and finding that 23 (out 32) of the sampled BSSs are indeed variables (see large empty circles in Fig. 7): 12 of them are FR-BSSs, while the remaining 11 are slow rotators. Almost all the detected variables (22 out of 23) are non binary systems, but pulsating stars classified as SX Phoeni- cis. The only exception star #2700834 (red cross in the figure), which is cataloged as a contact binary with asymmetric maxima as consequence of mass transfer. This is a FR-BSS with υ sin(i) = 104 km s−1, thus possibly indicating a system where MT is still ongoing, hence a proto-BSS in its way of formation.
Indeed, a high rotational velocity is commonly interpreted as a signature of recent BSS formation activity (see Sect. 1), but braking mechanisms are expected to then intervene and slow the stars down (Leonard & Livio 1995; Sills et al. 2005). Although timescales and efficiencies of these mechanisms are not fully understood yet, some constraints are starting to emerge from observational studies. The analysis of BSS rotation in open clusters (Leiner et al. 2018) suggests a timescale of the order of 1 Gyr for products of the MT formation scenarios. On other hand, by combining considerations on the formation epoch of COL- BSSs in the post-core collapse cluster M 30 (Ferraro et al. 2009; Portegies Zwart 2019), with the BSS rotation distribution presented in Lovisi et al. (2013a), a braking time-scale of 1–2 Gyr has been inferred also for COL-BSSs (Ferraro et al. 2023b). Thus, a large percentage of FR-BSSs reasonably traces a recent activity of BSS formation in the host cluster. The MT scenario should be dominant in low density environments, where stellar collisions are thought to be negligible. Hence, the correlation between the percentage of FR-BSSs and the binary fraction found in Ferraro et al. (2023b) indicates that an high percentage of FR-BSSs in low density systems (Fig. 6) should be interpreted as evidence of recent BSS formation activity due to the MT channel in primordial binaries.
The inspection of the Fig. 7 also suggests that FR-BSSs tend to populate the brightest portion of the BSS sequence: 12 FR- BSSs (out of 18 surveyed stars) are found at B < 17.2, while only 3 FR-BSSs (out of 14) can be counted in the lower portion of the sequence, thus indicating that FR-BSSs tend to be more luminous than slowly rotating BSSs. This is also supported by the cumulative magnitude distribution of the samples of slowly and rapidly rotating BSSs shown in Fig. 8. By using a Kolmogorov-Smirnov test, we find that the probability that the two distributions are extracted from the same parent population is of the order of 0.7% (roughly corresponding to a 2.5σ significance level). This is in good agreement with what observed in NGC 3201 (Billi et al. 2023). Conversely, we found no clear difference between the cumulative color (temperature) distributions of slow and fast rotating BSSs.
The dependence between rotational velocity and clustercentric distance for the BSSs surveyed in M 55 is plotted in Fig. 9. The trend is less clear here than in NGC 3201 (compare with Fig. 8 in Billi et al. 2023), and the Kolmogorov-Smirnov test detects no significant difference between the radial distributions of fast and slowly rotating BSSs. Nevertheless, we can notice that the BSSs with extremely large rotational velocities (v sin(i) > 200 km s−1), which are also the brightest in the surveyed sample (see Fig. 7), are all concentrated in the inner region of the cluster. As discussed in Billi et al. (2023), this can be explained by assuming that the fastest (and brightest) BSSs are also the most massive ones and, therefore, they suffered the effect of mass segregation that made them sink toward the cluster center. The difference in the radial distributions observed in M 55 and NGC 3201 is consistent with their different value of the  parameter, which quantifies the level of dynamical evolution experienced by the host cluster (Alessandrini et al. 2016). According to Ferraro et al. (2023a) (see also Lanzoni et al. 2016; Ferraro et al. 2018), M 55 has a value of
  significantly smaller than NGC 3201 (
 , compared to 0.19). This clearly indicates that M 55 is less dynamical evolved than NGC 3201, consistently with the detected difference in the trend between υ sin(i) and radial distance between the two clusters.
The comparison of the CMD position of the measured BSSs with theoretical evolutionary tracks can provide some additional insights. We should remind that caution is needed in estimating the mass of BSSs from the comparison with evolutionary tracks computed for normal single stars. However, Raso et al. (2019) found a reasonable agreement between the masses derived from single star evolutionary tracks and those estimated from the fitting of the observed spectral energy distribution, thus suggesting that the former can be used at least as first-guess indication. Figure 10 shows the CMD of M 55 zoomed in the BSS region, with the dashed lines corresponding to single-mass theoretical tracks extracted from the BASTI database (Pietrinferni et al. 2021) for masses ranging from 0.9 to 1.6 M⊙, stepped by 0.1 M⊙. The position of the fastest rotators in the sample (i.e., the four BSSs with rotation velocity larger than 190 km s−1) suggests that three of them (namely #200196, #200204, #2700733) have masses of the order of 1.1 M⊙, and the brightest object (#100108) is as massive as ~1.5 M⊙, very close to twice the cluster TO-mass.
This latter deserve a few comments. In fact, the Ca II K line is not visible in the spectrum of this very hot (Teff > 9700 K) BSS, because its extremely large rotational velocity has spread out the line and made it indistinguishable from the continuum. Hence, the assumed velocity of 200 km s−1 is indeed a lower limit. This BSS is located in the innermost region of the cluster, at only 52″ from the center, where optical, ground-based observations could be problematic. To confirm its peculiar position in the CMD, we therefore used HST data acquired with the WFC3 in the context of the HST UV Legacy Survey of Galactic GCs (see Piotto et al. 2015; Nardiello et al. 2018). Figure 11 shows the CMD of M 55 obtained in different HST filter combinations, with the BSSs included in the WFC3 field of view highlighted as large colored circles (same symbols as in Fig. 10). Clearly, star #100108 is the bluest and the brightest BSS, with a position well compatible with a mass of the order of 1.5–1.6 M⊙, in all filter combinations.
The evolutionary time of such a relatively massive star is expected to be quite fast, thus indicating that the formation of this BSS must have occurred recently. Interestingly, the evolutionary time read along the stellar track indicates that a 1.5 M⊙ star needs approximately 1 Gyr to reach the current CMD position of star #100108, from the instant of formation. Thus, this seems to be a BSS that, 1 Gyr after its formation, is spinning at a velocity higher than 200 km s−1 . Following this line of reasoning, the other three very FR-BSSs, which have masses significantly smaller (~ 1.1 M⊙) than BSS #100108, should be still spinning very rapidly after 3 Gyr from their formation. The reading of the evolutionary time from single star theoretical tracks therefore suggests a not particularly efficient braking mechanism, with newly-formed BSSs being able to maintain a strong rotation for several Gyr. However, we notice that also the FR- BSS #2700834 (classified as a contact binary with ongoing MT activity; see Kaluzny et al. 2010) is located at the same position in the CMD (see Fig. 7). This suggests that 1–3 Gyr old BSSs, as well as BSSs on the way of their formation, can occupy the same region of the diagram during their evolution. This result is indeed predicted by theoretical MT models specifically designed to describe the BSS population of M 30 (see Xin et al. 2015; Jiang et al. 2017). Thus, while a first-guess estimate of BSS masses can be reasonably derived from the comparison with single star evolutionary tracks, extreme caution must be taken in reading the evolutionary timescale from the same models. This emphasizes the urgency of complete grids of MT-BSS models for an appropriate reading of the BSS evolutionary path.
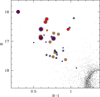 |
Fig. 7 CMD of M 55 zoomed in the BSS region, with the measured BSSs highlighted as large colored circles. The slowly rotating BSSs are marked with small blue circles. The FR-BSSs are plotted as increasingly larger circles for different colors for increasing rotational velocity (in units of km s−1 ): orange color for 40 ≤ υ sin(i) < 80, red color for 80 ≤ υ sin(i) < 180, and violet for υ sin(i) ≥ 180 km s−1. All the BSSs identified as variable stars in the Kaluzny et al. (2010) catalog are highlighted with large open circles. The FR-BSS classified as contact binary is marked with a large black cross. |
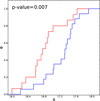 |
Fig. 8 Cumulative distribution of FR-BSSs (red line) and slowly rotating BSSs (blue line) as a function of the B magnitude. |
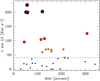 |
Fig. 9 BSS rotational velocities as a function of the radial distance from the cluster center. The symbols are as in Fig. 7. The dashed line marks the threshold adopted to distinguish fast-rotating from slowly rotating stars, namely υ sin(i) = 40 km s−1. |
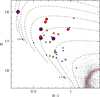 |
Fig. 10 CMD of M 55 zoomed in the BSS region, with the surveyed BSSs highlighted as colored circles (see Fig. 7). The dashed lines are evolutionary tracks extracted from the BASTI database (Pietrinferni et al. 2021) for stellar masses ranging from 0.9 to 1.6M⊙, stepped by 0.1 M⊙. The red solid line is the evolutionary track at 0.8 M⊙ reproducing the cluster MS-TO region. |
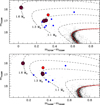 |
Fig. 11 As in Fig. 10, but for the BSSs sampled in the HST Wide Field Camera 3 (WFC3) field of view and for different color-magnitude combinations (see x- and y-labels). The four FR-BSSs are #100108 (the brightest and bluest one), #200204 and #200196 (the other large violet circles), and #200142 (red circle). |
Acknowledgements
This work is part of the project Cosmic-Lab (Globular Clusters as Cosmic Laboratories) at the Physics and Astronomy Department “A. Righi” of the Bologna University (http://www.cosmic-lab.eu/Cosmic-Lab/Home.html). A.B. acknowledges funding from the European Union NextGenerationEU.
References
- Alessandrini, E., Lanzoni, B., Ferraro, F. R., Miocchi, P., & Vesperini, E. 2016, ApJ, 833, 252 [NASA ADS] [CrossRef] [Google Scholar]
- Andronov, N., Pinsonneault, M. H., & Terndrup, D. M. 2006, ApJ, 646, 1160 [Google Scholar]
- Baumgardt, H., & Hilker, M. 2018, MNRAS, 478, 1520 [Google Scholar]
- Beccari, G., Ferraro, F. R., Dalessandro, E., et al. 2019, ApJ, 876, 87 [NASA ADS] [CrossRef] [Google Scholar]
- Behr, B. B., Cohen, J. G., & McCarthy, J. K. 2000a, ApJ, 531, L37 [NASA ADS] [CrossRef] [Google Scholar]
- Behr, B. B., Djorgovski, S. G., Cohen, J. G., et al. 2000b, ApJ, 528, 849 [CrossRef] [Google Scholar]
- Benz, W., & Hills, J. G. 1987, ApJ, 323, 614 [NASA ADS] [CrossRef] [Google Scholar]
- Billi, A., Ferraro, F. R., Mucciarelli, A., et al. 2023, ApJ, 956, 124 [NASA ADS] [CrossRef] [Google Scholar]
- Cadelano, M., Ferraro, F. R., Dalessandro, E., et al. 2022, ApJ, 941, 69 [CrossRef] [Google Scholar]
- Castelli, F., & Kurucz, R. L. 2003, IAU Symp., 210, A20 [Google Scholar]
- Castelli, F., Gratton, R. G., & Kurucz, R. L. 1997, A&A, 318, 841 [NASA ADS] [Google Scholar]
- Dalessandro, E., Ferraro, F. R., Massari, D., et al. 2013, ApJ, 778, 135 [NASA ADS] [CrossRef] [Google Scholar]
- Davies, M. B., Piotto, G., & de Angeli, F. 2004, MNRAS, 349, 129 [NASA ADS] [CrossRef] [Google Scholar]
- De Marco, O., Shara, M. M., Zurek, D., et al. 2005, ApJ, 632, 894 [NASA ADS] [CrossRef] [Google Scholar]
- de Mink, S. E., Langer, N., Izzard, R. G., Sana, H., & de Koter, A. 2013, ApJ, 764, 166 [Google Scholar]
- Ferraro, F. R., Fusi Pecci, F., & Buonanno, R. 1992, MNRAS, 256, 376 [NASA ADS] [CrossRef] [Google Scholar]
- Ferraro, F. R., Pecci, F. F., Cacciari, C., et al. 1993, AJ, 106, 2324 [Google Scholar]
- Ferraro, F. R., Fusi Pecci, F., & Bellazzini, M. 1995, A&A, 294, 80 [NASA ADS] [Google Scholar]
- Ferraro, F. R., Carretta, E., Corsi, C. E., et al. 1997, A&A, 320, 757 [NASA ADS] [Google Scholar]
- Ferraro, F. R., D’Amico, N., Possenti, A., Mignani, R. P., & Paltrinieri, B. 2001, ApJ, 561, 337 [NASA ADS] [CrossRef] [Google Scholar]
- Ferraro, F. R., Sills, A., Rood, R. T., Paltrinieri, B., & Buonanno, R. 2003, ApJ, 588, 464 [NASA ADS] [CrossRef] [Google Scholar]
- Ferraro, F. R., Sabbi, E., Gratton, R., et al. 2006, ApJ, 647, L53 [NASA ADS] [CrossRef] [Google Scholar]
- Ferraro, F. R., Beccari, G., Dalessandro, E., et al. 2009, Nature, 462, 1028 [NASA ADS] [CrossRef] [Google Scholar]
- Ferraro, F. R., Lanzoni, B., Dalessandro, E., et al. 2012, Nature, 492, 393 [Google Scholar]
- Ferraro, F. R., Lanzoni, B., Raso, S., et al. 2018, ApJ, 860, 36 [NASA ADS] [CrossRef] [Google Scholar]
- Ferraro, F. R., Lanzoni, B., Dalessandro, E., et al. 2019, Nat. Astron., 3, 1149 [NASA ADS] [CrossRef] [Google Scholar]
- Ferraro, F. R., Lanzoni, B., & Dalessandro, E. 2020, Rendiconti Lincei. Scienze Fisiche e Naturali, 31, 19 [NASA ADS] [CrossRef] [Google Scholar]
- Ferraro, F. R., Lanzoni, B., Vesperini, E., et al. 2023a, ApJ, 950, 145 [NASA ADS] [CrossRef] [Google Scholar]
- Ferraro, F. R., Mucciarelli, A., Lanzoni, B., et al. 2023b, Nat. Commun., 14, 2584 [NASA ADS] [CrossRef] [Google Scholar]
- Fiorentino, G., Lanzoni, B., Dalessandro, E., et al. 2014, ApJ, 783, 34 [NASA ADS] [CrossRef] [Google Scholar]
- Geller, A. M., & Mathieu, R. D. 2011, Nature, 478, 356 [NASA ADS] [CrossRef] [Google Scholar]
- Gilliland, R. L., Bono, G., Edmonds, P. D., et al. 1998, ApJ, 507, 818 [CrossRef] [Google Scholar]
- Gosnell, N. M., Mathieu, R. D., Geller, A. M., et al. 2014, ApJ, 783, L8 [Google Scholar]
- Gosnell, N. M., Mathieu, R. D., Geller, A. M., et al. 2015, ApJ, 814, 163 [Google Scholar]
- Harris, W. E. 1996, AJ, 112, 1487 [Google Scholar]
- Hills, J. G., & Day, C. A. 1976, Astrophys. Lett., 17, 87 [NASA ADS] [Google Scholar]
- Jiang, D., Chen, X., Li, L., & Han, Z. 2017, ApJ, 849, 100 [NASA ADS] [CrossRef] [Google Scholar]
- Kaluzny, J., Thompson, I. B., Krzeminski, W., & Zloczewski, K. 2010, Acta Astron., 60, 245 [Google Scholar]
- Kurucz, R. 1993, ATLAS9 Stellar Atmosphere Programs and 2 km/s Grid (Cambridge: Kurucz CD-ROM No. 13), 13 [Google Scholar]
- Kurucz, R. L. 2005, Mem. Soc. Astron. Ital. Suppl., 8, 14 [Google Scholar]
- Lanzoni, B., Dalessandro, E., Perina, S., et al. 2007, ApJ, 670, 1065 [Google Scholar]
- Lanzoni, B., Ferraro, F. R., Alessandrini, E., et al. 2016, ApJ, 833, L29 [NASA ADS] [CrossRef] [Google Scholar]
- Leigh, N., Sills, A., & Knigge, C. 2007, ApJ, 661, 210 [CrossRef] [Google Scholar]
- Leigh, N., Knigge, C., Sills, A., et al. 2013, MNRAS, 428, 897 [NASA ADS] [CrossRef] [Google Scholar]
- Leiner, E., Mathieu, R. D., Gosnell, N. M., & Sills, A. 2018, ApJ, 869, L29 [NASA ADS] [CrossRef] [Google Scholar]
- Leonard, P. J. T., & Livio, M. 1995, ApJ, 447, L121 [NASA ADS] [CrossRef] [Google Scholar]
- Lombardi, J. C. J., Rasio, F. A., & Shapiro, S. L. 1995, ApJ, 445, L117 [NASA ADS] [CrossRef] [Google Scholar]
- Lovisi, L., Mucciarelli, A., Ferraro, F. R., et al. 2010, ApJ, 719, L121 [NASA ADS] [CrossRef] [Google Scholar]
- Lovisi, L., Mucciarelli, A., Lanzoni, B., et al. 2012, ApJ, 754, 91 [Google Scholar]
- Lovisi, L., Mucciarelli, A., Dalessandro, E., Ferraro, F. R., & Lanzoni, B. 2013a, ApJ, 778, 64 [NASA ADS] [CrossRef] [Google Scholar]
- Lovisi, L., Mucciarelli, A., Lanzoni, B., et al. 2013b, ApJ, 772, 148 [CrossRef] [Google Scholar]
- Mathieu, R. D., & Geller, A. M. 2009, Nature, 462, 1032 [NASA ADS] [CrossRef] [Google Scholar]
- McCrea, W. H. 1964, MNRAS, 128, 147 [Google Scholar]
- Milliman, K. E., Mathieu, R. D., & Schuler, S. C. 2015, AJ, 150, 84 [CrossRef] [Google Scholar]
- Mucciarelli, A., Lovisi, L., Ferraro, F. R., et al. 2014, ApJ, 797, 43 [NASA ADS] [CrossRef] [Google Scholar]
- Nardiello, D., Libralato, M., Piotto, G., et al. 2018, MNRAS, 481, 3382 [NASA ADS] [CrossRef] [Google Scholar]
- Nine, A. C., Mathieu, R. D., Schuler, S. C., & Milliman, K. E. 2024, ApJ, 970, 187 [NASA ADS] [CrossRef] [Google Scholar]
- Packet, W. 1981, A&A, 102, 17 [NASA ADS] [Google Scholar]
- Pasquini, L., Avila, G., Blecha, A., et al. 2002, The Messenger, 110, 1 [Google Scholar]
- Perets, H. B., & Fabrycky, D. C. 2009, ApJ, 697, 1048 [Google Scholar]
- Pietrinferni, A., Hidalgo, S., Cassisi, S., et al. 2021, ApJ, 908, 102 [NASA ADS] [CrossRef] [Google Scholar]
- Piotto, G., De Angeli, F., King, I. R., et al. 2004, ApJ, 604, L109 [Google Scholar]
- Piotto, G., Milone, A. P., Bedin, L. R., et al. 2015, AJ, 149, 91 [Google Scholar]
- Portegies Zwart, S. 2019, A&A, 621, L10 [NASA ADS] [CrossRef] [EDP Sciences] [Google Scholar]
- Raso, S., Pallanca, C., Ferraro, F. R., et al. 2019, ApJ, 879, 56 [NASA ADS] [CrossRef] [Google Scholar]
- Sarna, M. J., & De Greve, J. P. 1996, QJRAS, 37, 11 [NASA ADS] [Google Scholar]
- Sbordone, L., Bonifacio, P., Castelli, F., & Kurucz, R. L. 2004, Mem. Soc. Astron. Ital. Suppl., 5, 93 [Google Scholar]
- Shara, M. M., Saffer, R. A., & Livio, M. 1997, ApJ, 489, L59 [NASA ADS] [CrossRef] [Google Scholar]
- Sills, A., & Pinsonneault, M. H. 2000, ApJ, 540, 489 [CrossRef] [Google Scholar]
- Sills, A., Adams, T., Davies, M. B., & Bate, M. R. 2002, MNRAS, 332, 49 [NASA ADS] [CrossRef] [Google Scholar]
- Sills, A., Adams, T., & Davies, M. B. 2005, MNRAS, 358, 716 [NASA ADS] [CrossRef] [Google Scholar]
- Sollima, A., Lanzoni, B., Beccari, G., Ferraro, F. R., & Fusi Pecci, F. 2008, A&A, 481, 701 [NASA ADS] [CrossRef] [EDP Sciences] [Google Scholar]
- Stetson, P. B., Pancino, E., Zocchi, A., Sanna, N., & Monelli, M. 2019, MNRAS, 485, 3042 [Google Scholar]
- Sun, M., Gossage, S., Leiner, E. M., & Geller, A. M. 2024, ApJ, 971, 80 [CrossRef] [Google Scholar]
- Tonry, J., & Davis, M. 1979, AJ, 84, 1511 [Google Scholar]
- VandenBerg, D. A., Brogaard, K., Leaman, R., & Casagrande, L. 2013, ApJ, 775, 134 [Google Scholar]
- Vink, J. S., & Cassisi, S. 2002, A&A, 392, 553 [NASA ADS] [CrossRef] [EDP Sciences] [Google Scholar]
- Xin, Y., Ferraro, F. R., Lu, P., et al. 2015, ApJ, 801, 67 [NASA ADS] [CrossRef] [Google Scholar]
The additional absorption line which is visible in the observed spectra at λ ~ 3931.3Å is due to the interstellar medium along to the line of sight. Note: the wavelength of this feature readable from Fig. 3 is not the rest frame one, because we shifted the observed stellar spectrum to the rest frame to make an appropriate comparison with the synthetic one, but the interstellar medium has a radial velocity different from that of M 55.
All Tables
All Figures
|
Fig. 1 Radial velocity distribution, as a function of the distance from the cluster center, obtained from the acquired spectra. The black and gray circles correspond to cluster members and Galactic field interlopers, respectively. The red dashed line marks the average radial velocity of the member star sample. |
| In the text | |
|
Fig. 2 CMD of M 55 (black dots) with the surveyed BSS, RGB and HB stars marked, respectively, as blue, red, and green circles. A set of BASTI isochrones (Pietrinferni et al. 2021) with ages ranging from 2 to 9 Gyr are overplotted as blue lines, a BASTI isochrone of 13 Gyr is overplotted as red line, and a BASTI HB model is overplotted as green line. |
| In the text | |
|
Fig. 3 Comparison between the observed spectra (black lines) and the synthetic spectra (red lines) of two BSSs with different rotational velocities (see labels). |
| In the text | |
|
Fig. 4 Rotational velocity distributions of RGB stars (top panel), HB stars (middle panel), and BSSs (bottom panel). |
| In the text | |
|
Fig. 5 HB region of the CMD of M 55 with the observed stars highlighted with different markers: small green circles for HB stars with υ sin(i) < 20 km s−1, large green squares for those rotating faster (up to 40 km s−1). |
| In the text | |
|
Fig. 6 Percentage of FR-BSSs as a function of the central density of the parent cluster, for the systems studied in Ferraro et al. (2023b). The position of M 55 is highlighted in blue. |
| In the text | |
|
Fig. 7 CMD of M 55 zoomed in the BSS region, with the measured BSSs highlighted as large colored circles. The slowly rotating BSSs are marked with small blue circles. The FR-BSSs are plotted as increasingly larger circles for different colors for increasing rotational velocity (in units of km s−1 ): orange color for 40 ≤ υ sin(i) < 80, red color for 80 ≤ υ sin(i) < 180, and violet for υ sin(i) ≥ 180 km s−1. All the BSSs identified as variable stars in the Kaluzny et al. (2010) catalog are highlighted with large open circles. The FR-BSS classified as contact binary is marked with a large black cross. |
| In the text | |
|
Fig. 8 Cumulative distribution of FR-BSSs (red line) and slowly rotating BSSs (blue line) as a function of the B magnitude. |
| In the text | |
|
Fig. 9 BSS rotational velocities as a function of the radial distance from the cluster center. The symbols are as in Fig. 7. The dashed line marks the threshold adopted to distinguish fast-rotating from slowly rotating stars, namely υ sin(i) = 40 km s−1. |
| In the text | |
|
Fig. 10 CMD of M 55 zoomed in the BSS region, with the surveyed BSSs highlighted as colored circles (see Fig. 7). The dashed lines are evolutionary tracks extracted from the BASTI database (Pietrinferni et al. 2021) for stellar masses ranging from 0.9 to 1.6M⊙, stepped by 0.1 M⊙. The red solid line is the evolutionary track at 0.8 M⊙ reproducing the cluster MS-TO region. |
| In the text | |
|
Fig. 11 As in Fig. 10, but for the BSSs sampled in the HST Wide Field Camera 3 (WFC3) field of view and for different color-magnitude combinations (see x- and y-labels). The four FR-BSSs are #100108 (the brightest and bluest one), #200204 and #200196 (the other large violet circles), and #200142 (red circle). |
| In the text | |
Current usage metrics show cumulative count of Article Views (full-text article views including HTML views, PDF and ePub downloads, according to the available data) and Abstracts Views on Vision4Press platform.
Data correspond to usage on the plateform after 2015. The current usage metrics is available 48-96 hours after online publication and is updated daily on week days.
Initial download of the metrics may take a while.