| Issue |
A&A
Volume 686, June 2024
|
|
|---|---|---|
| Article Number | A241 | |
| Number of page(s) | 11 | |
| Section | Extragalactic astronomy | |
| DOI | https://doi.org/10.1051/0004-6361/202348981 | |
| Published online | 17 June 2024 | |
AstroSat observations of interacting galaxies NGC 7469 and IC 5283⋆
1
Astronomisches Rechen-Institut, Zentrum für Astronomie der Universität Heidelberg, Mönchhofstr. 12–14, 69120 Heidelberg, Germany
e-mail: This email address is being protected from spambots. You need JavaScript enabled to view it.
2
Department of Physical Sciences, Indian Institute of Science Education and Research Mohali, Knowledge City, Sector 81, SAS Nagar, Punjab 140306, India
e-mail: This email address is being protected from spambots. You need JavaScript enabled to view it.
, This email address is being protected from spambots. You need JavaScript enabled to view it.
3
Inter-University Centre for Astronomy and Astrophysics, Ganeshkhind, Pune 411007, India
Received:
16
December
2023
Accepted:
11
April
2024
Abstract
Aims. We carry out deep near-ultrviolet (NUV) and far-ultrviolet (FUV) imaging of an interacting galaxy system, comprised of a Seyfert type 1 galaxy NGC 7469 and its companion IC 5283. Our aim is to resolve and map the star-forming regions in the outer arms and look for signs of interaction between the two galaxies.
Methods. We used AstroSat Ultra Violet Imaging Telescope (UVIT) to obtain NUV and FUV images of NGC 7469 in a range of filters. We have carried out photometry of star-forming regions in the two galaxies and found their spatial distributions. We also obtained the distributions of star formation rates (SFR) in NGC 7469 and IC 5283 using the estimates obtained from the FUV and NUV bands. We also carried out Kolmogorov-Smirnov tests to look for differences in the SFRs in the two galaxies. We derived the spectral energy distribution (SED), leading to the determination of physical parameters, including the overall SFR, stellar mass (M*), dust mass (MDust), and specific star formation rates (sSFRs) in both the galaxies.
Results. Our NUV and FUV images show the presence of an outer spiral arm that is better resolved. We have identified 33 new star-forming regions out of 51 total identified in the UVIT composite image. Enhanced star formation activity is observed to coincide with the interaction, and KS tests show that there are no significant differences in the SFR distributions of NGC 7469 and IC 5283, indicating that the interaction between the galaxies has not influenced their star formation processes differently. The SED plots and the photometric results demonstrate that most of the star formation activity is confined inside the central starburst (SB) ring.
Key words: galaxies: interactions / galaxies: photometry / galaxies: Seyfert / galaxies: star formation
The flux values are available at the CDS via anonymous ftp to cdsarc.cds.unistra.fr (130.79.128.5) or via https://cdsarc.cds.unistra.fr/viz-bin/cat/J/A+A/686/A241
© The Authors 2024
 Open Access article, published by EDP Sciences, under the terms of the Creative Commons Attribution License (https://creativecommons.org/licenses/by/4.0), which permits unrestricted use, distribution, and reproduction in any medium, provided the original work is properly cited.
This article is published in open access under the Subscribe to Open model. This email address is being protected from spambots. You need JavaScript enabled to view it. to support open access publication.
1. Introduction
Studies of interacting galaxies have made significant contributions to our understanding of galaxy evolution and the processes that shape their morphology, star formation, and nuclear activity. The gravitational interaction between galaxies can disrupt the equilibrium of the systems due to tidal forces, leading to the emergence of intricate morphologies that deviate from the regular, symmetric shapes observed in isolated galaxies. For example, it can lead to the formation of tidal tails, bridges, and shells (Toomre & Toomre 1972; Schweizer 1982; Barnes & Hernquist 1992). These morphological features provide evidence of the dynamical interaction between galaxies and are often used as indicators of past or ongoing interactions.
The increased gravitational perturbations, gas compression, and shocks associated with interactions can also lead to enhanced star formation activity, leading to the formation of starburst (SB) regions, where star formation occurs at a rate significantly higher than that observed in isolated galaxies (Sanders & Mirabel 1996; Kennicutt 1998; Barton et al. 2000; Matteo et al. 2008). Furthermore, interactions between galaxies can influence nuclear activity by driving gas inflows towards the central regions, triggering accretion onto the supermassive black holes (SMBHs) that reside at the cores of many galaxies (Hernquist 1989; Hopkins et al. 2006a). This process can result in the activation of active galactic nuclei (AGNs), accompanied by the release of significant amounts of energy across a wide range of wavelengths (Kormendy & Ho 2013). By examining these interactions across different wavelengths, we can gain a more comprehensive understanding of the underlying physical processes at play.
One such interacting system consists of a Seyfert 1 galaxy NGC 7469 and its neighbor, IC 5283. This system is also known as Arp 298. The two galaxies have been observed by a number of telescopes at many different wavelengths over the years and their salient features are described below. NGC 7469 is an intermediate spiral galaxy – SABa type. It is located at a redshift of z = 0.0163 and is one of the brightest (V = 13 mag) nearby AGN and has been studied extensively in multiple wavebands (Wanders et al. 1997; Nandra et al. 1998; Kriss et al. 2003). Optical observations suggest the presence of a bar-like structure (connecting them to the central source), which influences the formation and morphology of the two major spiral outer arms of the galaxy NGC 7469 (Kormendy & Kennicutt 2004; Davies et al. 2004; Laine et al. 2006). Moreover, HST has provided high-resolution images that reveal intricate details of these spiral arms, bar, and nucleus (Cazzoli et al. 2020; Izumi et al. 2020). Dark dust lanes, a consequence of interstellar dust absorbing and scattering light Calzetti (2001), are seen in the optical images as well. Nebulae and HII regions within the arms, visible in optical wavelengths, contribute to the overall richness of NGC 7469’s appearance.
Earlier observations have also shown the presence of an inner starburst (SB) ring around the nucleus of NGC 7469, discovered in radio by Ulvestad et al. (1981) and Soifer et al. (2003) and later imaged in optical and in the infrared (IR) (Díaz-Santos et al. 2007) surrounding an inner circumnuclear disk (CND) by Davies et al. (2004) and Izumi et al. (2015). Later observations by ALMA resolved the sizes of the AGN, CND, and SB ring to be about 1″, 3″, and 5″ from the centre (Izumi et al. 2015, 2020). These radio observations from ALMA by Izumi et al. (2020), accompanied by VLBA observations by Lonsdale et al. (2003) showed the presence of a compact, flat-spectrum radio source in the nucleus of the galaxy, which is a characteristic of Seyfert galaxies and is believed to be associated with accretion onto a central supermassive black hole. It was discovered as an X-ray source by Forman et al. (1978) based on observations with the UHURU satellite. Further X-ray observations have revealed the presence of a luminous X-ray source in the nucleus, which is possibly related to the accretion process (Hernquist 1989; Hopkins et al. 2006b).
The AGN and the inner SB region emit predominantly in the IR regime in NGC 7469 (Scoville et al. 2000). Observations by Galaxy Evolution Explorer (GALEX)1 in FUV and NUV (Gil de Paz et al. 2007) have reported that the NGC 7469 is a ultraviolet luminous galaxies (UVLGs), according to the criteria reported in Heckman et al. (2005). These observations show very few knot-like features at the northwest side of the galaxy NGC 7469, but with very poor resolution (Gil de Paz et al. 2007, 2009). Observations with the XMM-Optical Monitor (OM) also show the presence of inner spiral arms (≈30 arcsecs), and some fainter outer arms of NGC 7469 (≈60 arcsecs) are also visible, but these two components are unresolvable (Blustin et al. 2003). In the case of IC 5283, the UV emission is more or less homogeneous, and three distinct parts were seen by the XMM-OM (Blustin et al. 2003).
NGC 7469 exhibits prominent signs of interaction, including tidal features and asymmetrical structures (Moles et al. 1995). It is apparently interacting with a neighboring Scd galaxy, IC 5283, which is at the same optical redshift. IC 5283 appears to have a knotty distribution and a semi-detached tidal tail (Marquez & Moles 1994). Together these two galaxies form an isolated pair of interacting galaxies located at 66.5 Mpc (H0 = 67.8 km s−1 Mpc−1, Ωm = 0.308, Ωvac = 0.692) in the constellation of Pegasus known as Arp 298, KPG 575, or Holm 803. Some general properties of these two interacting galaxies (also known as NGC 7469 and IC 5283) are summarised in Table 1. The companion galaxy IC 5283 is located at a projected distance of approximately 50 kpc from NGC 7469 (Moles et al. 1995). IC 5283 is classified as a barred spiral galaxy and exhibits distinctive morphological features that provide evidence of its interaction with NGC 7469. The presence of tidal features, such as tidal tails or bridges, and asymmetric structures indicate the dynamical influence exerted by the gravitational interaction between the two galaxies (Moles et al. 1995). These morphological signatures suggest that IC 5283 has been subjected to significant perturbations, leading to its present appearance. It has been suggested in Greene et al. (2004) that NGC 7469 is drawing gas from the southeast side of IC 5283 and that the two galaxies are counter-rotating. Additionally, other studies have explored the impact of the interaction on IC 5283’s star formation activity and nuclear properties, shedding light on the interplay between the interacting galaxies (Pereira-Santaella et al. 2011; Sliwa & Downes 2017).
General characteristics of the interacting galaxies NGC 7469 and IC 5283.
In this paper, we present the UV imaging observations of the pair of galaxies, NGC 7469 and IC 5283, carried out with the Ultra-Violet Imaging Telescope (UVIT) (Tandon et al. 2017) aboard AstroSat (Singh et al. 2014). The higher spatial resolution of the UVIT (1.2−1.4 arcsec), as compared to GALEX (5 arcsecs) helps us gain a more detailed perspective on the star-forming regions within NGC 7469 and its companion galaxy, IC 5283, and to discern the intricate structures and properties of these regions.
The paper is organised as follows. We present the observational details in Sect. 2, followed by the data reduction techniques used and the images obtained in the various near-ultraviolet (NUV) and far-ultraviolet (FUV) bands in Sect. 3. In Sect. 4, we present a further analysis by performing aperture photometry on UV images and identifying star-forming regions of these galaxies. Here, we also give the derived parameters of the star-forming regions and the results of performing Kolmogorov-Smirnov (KS) tests on the parameters of the two galaxies to see differences (if any) between the star-forming regions of the two galaxies. We present the multi-wavelength photometric analysis of the UV data in Sect. 5. The spectral energy distributions (SED) of the two galaxies are presented here along with the extracted physical parameters, such as the star formation rate (SFR), stellar mass (M*), dust mass (MDust), and specific star formation rate (sSFR) for both galaxies. In Sect. 6, we summarise our results. The results pertaining to the nuclear activity in NGC 7469 obtained from these observations have previously been presented in Kumari et al. (2023) and Kumar et al. (2023).
2. Observations
Observations of NGC 7469 and IC 5283 were carried out by AstroSat on 7 August 2017 and 15 October 2017 with the UVIT, in the NUV and FUV bands in photon-counting mode (see (Tandon et al. 2017, 2020) for more details). Two 37.5 cm Ritchey-Chrétien telescopes make up the UVIT: one is used to view the FUV (range: 130 nm to 180 nm) and the second consists of a dichroic beam splitter that separates the beam into NUV (190–304 nm) and visible (VIS: 304 nm–550 nm) channels. Each channel consists of many filters as given in Tandon et al. (2020). The data from the VIS channel are used to track the spacecraft and not meant for scientific purposes.
The observations were carried out when the Sun avoidance angle was ≥45° and the RAM angle (> 12°), where the RAM angle is the angle between the payload axis to the velocity vector direction of the spacecraft. The UVIT observations and the resulting datasets used here are listed in Table 2. In this table, we also list the observations for all the instruments whose data were used in this paper, along with the filters that were used for the FUV and NUV observations. The filters used, the start and stop times, and the useful exposure times obtained are also provided.
Log of observations of the Seyfert Galaxy NGC 7469 and IC 5283 in the UVIT Filters.
3. Data reduction and imaging
We downloaded level-1 data from the AstroSat archive2. The data contained individual orbit-wise FUV and NUV data files as FITS binary tables, organized by file type and orbit numbers. The photon counting mode data contain lists of photon detection events with their centroid positions. The data were analysed using CCDLAB (Postma & Leahy 2021, 2017). The image reduction included collating all orbit-wise data into individual directories, performing fidelity checks, instrument corrections like field distortions and flat fielding, exposure array corrections, correcting for drifts using the VIS data, and applying the World Coordinate System (WCS). The final science products were extracted after co-aligning all the orbit-wise data for all available AstroSat observations, producing the final images in each filter.
4. Analysis and results
4.1. UV images
A composite image made from three filters, N245M, F172M, and F154W, focussing on the two galaxies is shown in the upper panel of Fig. 1. The image shows the central bulge, inner arms, and outer spiral arms of NGC 7469. An optical composite image obtained from the three Sloan Digital Sky Survey (SDSS) filters (r, g, and v) is also shown in the lower panel of this figure. Our observations clearly resolve the two major spiral arms and show the star-forming regions. The image also shows diffuse emission in the outer disc of NGC 7469. In the case of the companion galaxy IC 5283, we detected diffuse emission and many star-forming regions via a photometric procedure as described below.
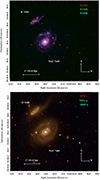 |
Fig. 1. Composite RGB image of NGC 7469 created using the N245M (red), F172M (green), and F154W (blue), respectively (top). This image clearly shows the presence of inner spiral arms, and knots which act as evidence of the star formation occurring in the arms of the galaxy. A composite RGB image of NGC 7469 was created using the SDSS frames, SDSS-r(red), SDSS-g (green), and SDSS-u (blue) respectively (bottom). Clearly, the spiral arms are better resolved in the UVIT image, compared to the SDSS image. |
4.2. UV photometry
We performed aperture photometry of the star-forming regions in the galaxies NGC 7469 and IC 5283 using the SEXTRACTOR software developed by Bertin & Arnouts (1996). We use ‘SF regions’ to designate the star-forming regions interchangeably henceforth. A detailed procedure for the identification of SF regions, distribution of their sizes, and extraction of fluxes of these regions for both galaxies is outlined below.
4.2.1. Identification of star-forming regions
We extracted the SF regions from a subsection of the image of the size of 427 × 370 pixels (1 pixel= 0.417 arcsec) centred on (α, δ) = (23h03m13.8s, 8° 53m35.0s). The minimum number of pixels for identification of an SF region was fixed to 10 (DETECT_MINAREA = 10), which is equivalent to the area of a circle of diameter ∼3.5 pixels (approximating the FWHM of the PSF of the UVIT). We used elliptical shapes for the SF regions. We de-blended the SF regions with 32 subthreshold (DEBLEND_THRESHOLD = 32) and a minimum contrast parameter value of 0.005 (DEBLEND_MINCONT = 0.005). UVIT has a resolution of ∼1.4 arcsec in the FUV and ∼1.2 arcsec in the NUV band which means that UVIT can resolve SF regions in the NGC 7469 down to approximately 0.16 kpc2 in the FUV and 0.14 kpc2 in the NUV bands. The background level was automatically detected and SExtractor gives the background subtracted photometric counts of the SF regions (parameter BACK_TYPE = AUTO). We required a minimum flux of 4σ above the background in a pixel, where σ is the average sky noise for a source to be registered.
These parameters were used to detect the SF regions in all the filters which resulted in the detection of 45, 34, 23, and 32 SF regions in N245M, F154W, N279N, and F172M filters, respectively. The SF regions selected (in the individual filters) are such that there is no overlap between them, thus avoiding any contamination from the adjacent regions. The main parameters used are listed in Table 3 and the spatial distribution of the SF regions detected in various UVIT filters is shown in Fig. 2. The regions L2, R1, M1, and T1, in the N245M, N279N, F154W, and F172M filter (respectively) were identified using manual inspection. The reason that these regions were not detected using the SExtractor is mostly due to their high background counts due to diffuse emission and/or due to confusion regarding unresolved regions. Some regions in close vicinity of the smaller SF regions were not detected by SExtractor in some filters, for example, L40 is in close vicinity of smaller SF regions (T30 and T31) and were not detected in the N245M filter. However, the radial profile of L40 showed a smaller variation due to the smaller regions. Therefore, the L40 region was corrected by manually encompassing the undetected regions using radial profiles. The regions R7, L32, M34, and L35 were also corrected for the same reason. All the SF region parameters such as the RA and Dec, as well as the parameters for the elliptical region, flux, and SFR, have been made electronically available.
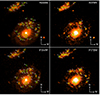 |
Fig. 2. NGC 7469 and IC 5283 photometry showing the star-forming regions (in green ellipses) in the N245M, F154W, N279N, and F172M filters, identified with the help of SExtractor using the parameters given in Table 3. A similar SF region’s identification process was done for all the other UVIT filters, as noted in Sect. 4.2. |
SEXTRACTOR (version v1.2b14) parameters used for the analysis of the UVIT images.
We identified a total of 51 SF regions, out of which 18 regions were detected by the previous observations for both galaxies. We have shown these regions plotted over the HST image in Fig. 3. Overall, 33 new SF regions were identified, as compared to previous observations (Díaz-Santos et al. 2007; Pérez-Torres et al. 2009; Ramos Almeida et al. 2011).
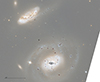 |
Fig. 3. Comparison between new and previously detected clumps plotted on the HST image available at https://esahubble.org/. The previous clumps and SF region detections are marked in black dots. We detected 51 unique SF regions identified using RA and Dec in all the UVIT filters. We identified 33 new SF regions which are shown in black crosses whereas the red open circles (enclosing black dots) represent the clumps and SF regions (18) that were detected both by the UVIT and had been observed previously. |
4.2.2. Sizes of the star-forming regions
SEXTRACTOR gives us the lengths of semimajor and semiminor axes in pixel coordinates and position angles in degrees corresponding to each elliptical-shaped SF region. We converted these to arcseconds and then to kpc using the redshift value of z = 0.0163. We noticed that the areas of the SF regions detected in UV (N245M, F154W, N279N, and F172M) vary from 0.17 kpc2 to 3.24 kpc2 in the FUV bands and 0.24 kpc2 to 5.68 kpc2 in the NUV bands. The distribution of the areas of the SF regions (segregated by filters and galaxies) is shown in Fig. 4. The median value of the SF regions area are 1.24 kpc2 for the N245M filter, 1.31 kpc2, 1.61 kpc2 for the F154W filter, and 0.71 kpc2 for the F172M filter. Other studies have also identified and calculated the sizes of the SF regions in different galaxies using UVIT. For example, for a nearer galaxy, NGC 2336, (z = 0.00735) studied by Rahna et al. (2018), the median distribution of the SF sizes comes out to be 0.63 kpc2 and 0.48 kpc2 in F154W and N242W filters, respectively (assuming circular SF regions), based on the results given in Rahna et al. (2018). The UVIT, however, does much better for the dwarf Seyfert galaxy NGC 4395 which is much closer at z = 0.00106 and has been studied by Nandi et al. (2023). These authors reported the SF regions sizes using the F148W filter as varying from 8.6 × 10⁻⁴ kpc2 to 488.1 × 10⁻⁴ kpc2 with a median of 40.2 × 10⁻⁴ kpc2.
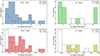 |
Fig. 4. Distribution of areas of the SF regions detected by SExtractor in NGC 7469 and IC 5283 in various UVIT filters. |
In some of the filters, there are regions where multiple clumps are identified as one larger clump in IC 5283. This might have several implications for the interpretation of observational data and the analysis of star formation activity in galaxies. We tried to reduce this as much as possible, as the presence of such structures could lead to overestimation or underestimation of the fluxes and apparent magnitudes of such regions.
The distribution of the sizes of the SF regions is different in both galaxies. We also see a tidal tail in IC 5283. Although a similar SFR distribution, Marquez & Moles (1994) suggests that the galaxies have produced very different responses to the interaction, particularly regarding the distribution of the star formation regions (also true in our case).
4.2.3. Other parameters of star-forming regions
The fluxes for the star-forming regions were derived from the observed counts (derived from SEXTRACTOR) using the conversion factors given in Tandon et al. (2020) and online3 implemented in Python code. The positions, calculated flux values, and the distance4 of the SF regions from the central AGN in each UVIT filter for NGC 7469 and IC 5283 are presented in the electronic format in the CDS.
The SF regions exhibit varying sizes and levels of UV emission, indicative of ongoing star formation activity. The far-ultraviolet (FUV) light, spanning the wavelength range from 120 to 320 nm, is predominantly emitted by stars with masses of several solar masses and mean ages ranging from 10 to 100 million years (Myr) (Hao et al. 2011; Murphy et al. 2011; Kennicutt & Evans 2012). This emission is closely associated with recent star formation activities within a galaxy (Pérez-González et al. 2006).
We estimated the star formation rate (SFR) in the SF regions by using the prescription provided by Iglesias-Páramo et al. (2006) and Wang et al. (2016) based on the FUV and NUV luminosities. The distribution of the SFR in the SF regions is provided in Fig. 5. This approach takes into account the known relationship between the FUV and NUV emission and the presence of young, massive stars and consequently derives an estimate of the recent star formation rate within the galaxy under investigation.
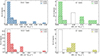 |
Fig. 5. Distribution of SFR of NGC 7469 and IC 5283 in various UVIT filters. |
The FUV and NUV star formation rates are given by:


where LFUV and LNUV are the luminosities in the F154W and F172M filters and the N245M and N279N luminosities, respectively, of the galaxy corrected for Galactic extinction (AFUV) and (ANUV). The calibration for this prescription is derived from Starburst99 models (Leitherer et al. 1999), assuming a solar metallicity and a Salpeter initial mass function (IMF) from 0.1 − 100 M⊙. Galactic extinction, AV = 3.1 × E(B − V) (Mehdipour et al. 2018), where the colour excess E(B − V) = 0.061 for NGC 7469 and IC 5283 is obtained from the dust reddening maps of Schlafly & Finkbeiner (2011).
We also investigated whether the interaction between the two galaxies might have occurred along one of the directions. We created a box of length and width of 1.5′ and 1.55′ (respectively) at an angle of 130° centred on the central AGN source (RA, Dec) = (23:03:15.49, +8:52:29.03). We drew a line parallel to the width passing through the central AGN with coordinates (RA, Dec) = (23:03:15.60, +8:42:26.00). This way, we split the NGC 7469 into two halves: R1 and R2, containing the northern arms and southern arms, respectively. We plotted the flux values (in μJy) in various UVIT filters as a function of distance from the central AGN for both the divided regions (shown in Fig. 6). The flux values for the SF regions in the regions R1 and R2 are shown by blue squares and red circles, respectively. The green line shows the median of the overall flux values. We tabulate the flux values in the tables, available electronically at the CDS portal. We can see that the star-forming regions in the R1 area (refer to Fig. 6) have higher flux values regions (and, hence, SFR) compared to the R2 region, in all of the UVIT filters. There is a clear indication that there is an enhanced star formation process going on in the outer arms lying towards the northwest side of the NGC 7469, which supports the theory that the interaction between NGC 7469 and the IC 5283 might have triggered the star-formation process; this is similar to the conclusion reported by Dopita et al. (2002). It is possible that the interaction might have taken place from the direction of the northwest side of NGC 7469, as it was in close vicinity of the IC 5283 galaxy.
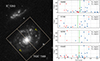 |
Fig. 6. Star-forming regions (see Fig. 2) of the galaxy NGC 7469 (N245M filter) divided by the areas – R1 and R2 containing northern and southern arms, respectively (left). The measurements of the box size and division are provided in Sect. 4.2.3. North is up and west is left. The plot showing the distance from the central AGN as a function of flux values (in μJy) of the star-forming regions (refer the electronically available Tables) in the R1 and R2 areas is shown by blue squares and red circles, respectively, in various UVIT filters (right). The green line is the median flux value of the SF regions in those filters. It clearly shows the enhanced star-formation process occurring in the R1 region suggesting that the interaction might have occurred along that arm. |
We note that obscuration by dust internal to the galaxy can affect observations in the ultraviolet (UV) wavelengths and may have several consequences on the derived properties of galaxies, such as the estimated number of clumps, their sizes, and star formation rates (SFR) (Calzetti 2001; Wijesinghe et al. 2011). Since UV emission is often associated with regions of active star formation, such as young stellar clusters or star-forming regions, it can obscure these regions, making them less visible or undetectable in UVIT data (Swain et al. 2023). This can lead to an underestimate of the number of detected star-forming clumps or an incomplete census of star-formation activity within the galaxy, the underestimation of UV flux, and, consequently, the SFR values.
4.3. Kolmogorov-Smirnov (KS) tests
We employed the Kolmogorov-Smirnov (KS) test (Shiryayev 1992) to assess the similarity or dissimilarity between the SFR’s distributions in the NGC 7469 and IC 5283. The KS test was performed separately for all the UVIT filters and the results are presented in Table 4. The lowest p-value is seen in the F154W filter which has the widest wavelength band of 140 − 175 nm. The F154W filter has the highest sensitivity for the helium recombination line (HeII) at 164 nm, OIII line at 166.3 nm, and NII line at 173.7 nm; these are strong indicators of massive star formation (see also Leitherer 2020), especially the He recombination line Senchyna et al. (2021). This suggests that the distribution of massive O/WR stars in these galaxies is different. On the other hand, the other FUV filter F172M is comparatively narrower and displays a lower efficiency. The NUV filters are much narrower in their wavelength range and cover only weaker lines of NeIV and MgII, considered as the indicators of star formation activity. From the KS test results, there is no significant difference seen in the SFR distributions between the two galaxies’ star-forming regions in the N245M, F172M, and N279N filters. The similar distribution of SFR in three filters indicates that, overall, the star formation processes in both NGC 7469 and IC 5283 are comparable. This might be attributed to factors such as the overall gas content, density, or gravitational interactions between the galaxies, which influence the star formation rates consistently across multiple filters. However, understanding the physics driving the low p-value in the F154W filter requires further analysis and possibly additional observational data.
Results obtained from Kolmogorov-Smirnov test for the comparison of SFR distributions in NGC 7469 and IC 5283 in different filters.
5. Spectral energy distributions
We obtained the SED of the integrated emission of the galaxies by combining the UV data with the optical and IR data from the archives as detailed below.
5.1. Optical data
The optical photometric data utilized in this study were obtained from SDSS, specifically from Data Release 14 (Moles et al. 1995). The SDSS images were exposed for a duration of 53.9 seconds in each of the five filters: u, g, r, i, and z. Photometric measurements were carried out in all four wavebands and the resulting counts were subsequently converted to fluxes in Jansky (Jy), using the standard conversion factor.
5.2. Infrared Data
The IR photometric data for NGC 7469 and IC 5283 were obtained from the various surveys and are presented in Table 5. The near-IR (NIR) data included images from WISE W1, W2, and W3. Moreover, 2MASS images used in this study were acquired through the J filter. The FIR data have been acquired from surveys like IRAS and SCUBA (Sanders et al. 2003 and Dunne et al. 2000). Our flux measurements (provided in Table 5) are compatible with the existing literature values (Jarrett et al. 2003).
Integrated flux measurements for NGC 7469 and IC 5283 in different wavebands, in increasing order of wavelength from top to bottom.
The integrated flux measurements of the entire galaxy, NGC 7469 (in different UV filters) were obtained by using a photometric radius of 0.9′ to study its SED. Similarly, 0.55′ and 0.3′ were the values chosen as semi-major and semi-minor axis, respectively, for the flux measurements and SED analysis of the IC 5283 galaxy. The measured integrated flux values for the two galaxies are given in Table 5. The SEDs of the integrated galaxy emission for NGC 7469 and IC 5283 are shown in Fig. 7.
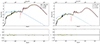 |
Fig. 7. Integrated UV to NIR spectral energy distribution (SED) of the galaxies NGC 7469 and IC 5283. In this two-panel plot, the top panel shows the photometric data from Table 5 for the two galaxies are shown as yellow dots which were used to fit a SED using the code MAGPHYS (da Cunha & Charlot 2011). The blue dashed line represents the unabsorbed stellar component, while the red dashed lines show the dust re-emission. The black solid line represents the total emission. The bottom panel shows the residuals concerning the best fit. The parameters χ2 and zs represent the chi-square of the best-fit model and the redshift of the galaxy, respectively. Table 6 provides the extracted physical parameters derived from this SED fitting. |
5.3. Modelling of the SED
The SED was analysed using the MAGPHYS (Multi-wavelength Analysis of Galaxy Physical Properties) code (da Cunha et al. 2008). The MAGPHYS code utilises a combination of stellar population synthesis models and dust emission models to constrain various physical parameters of galaxies. It combines BC03 optical/NIR stellar models, which includes the effects of dust attenuation as described in Charlot & Fall (2000). The MIR/FIR dust emission computed as in da Cunha et al. (2008), linking the two components through energy balance: the total energy absorbed by dust in stellar birth clouds and in the ambient interstellar medium is re-distributed at IR wavelengths. The SED fit uses the observed flux densities from UV to FIR wavelengths (see Table 5) with a grid of model SEDs that span a range of star formation histories, stellar masses, dust properties, and other parameters.
By comparing the observed flux densities with the model grid, we derived the best-fit values for several key physical parameters like the star formation rate (SFR), stellar mass (M*), dust mass (MDust), and specific star formation rate (sSFR) and the procedure is outlined below. These values are listed in Table 6. The best-fit models for the SEDs of the integrated galaxy emission for NGC 7469 and IC 5283 are shown in Fig. 7.
Comparison of NGC 7469 and IC 5283 with respect to the physical parameters estimated with the SED fitted using the MAGPHYS code (da Cunha et al. 2008).
Star formation history is an important tool for understanding the intrinsic evolution of a galaxy and the effects of interactions with its neighbouring systems (Ripepi et al. 2014). We extracted the total star-formation rate (SFR) of the two galaxies using MAGPHYS (Kennicutt & Evans 2012) and by combining the UV and IR emissions, which are sensitive to young and dust-enshrouded star formation, respectively. The MAGPHYS code utilises stellar population models to estimate the stellar mass by matching the observed SED with models that account for various stellar ages and metallicities (Walcher et al. 2011). On the other hand, the dust absorbs the UV emission of young stars, allowing gas to cool and condense to form new stars. Dust emission (IR and sub-mm) regimes) is often used to trace the ongoing rate of star formation (Nordon et al. 2010, 2012; Elbaz et al. 2011; Kelvin et al. 2014).
We determined the dust mass (MDust) in NGC 7469 and IC 5283 by incorporating dust emission models in MAGPHYS. This is the amount of dust available for obscuring starlight and potentially fuelling star formation processes (da Cunha et al. 2010). We also derived the specific star formation rate (sSFR) for NGC 7469. The sSFR represents the star formation rate normalised by the stellar mass and provides a measurement of the relative level of ongoing star formation activity compared to the existing stellar population. It is a key quantity in characterising the evolutionary state of galaxies, with high sSFR values indicating more intense star formation relative to the stellar mass (Elbaz et al. 2011).
The ratio between the stellar masses of the two galaxies is 0.3 (IC 5283/NGC 7469), suggesting that these galaxies are undergoing a major merger. In Larson et al. (2016), a merger sequence is listed based on the visual classification of different interacting galaxy systems, including NGC 7469 and IC 5283. In this sequence, the merger is denoted by M1 to M5 with an increasing number corresponding to later stages of mergers. Another criterion of the merger status is the projected distance, a distance larger than 10 kpc corresponds to interacting systems at stages M1 (galaxies in initial approach) and M2 (visible tidal tails). The visual inspection classifies this galaxy system as major merger stage 2 (M2), where the interacting galaxy pairs have prominent tidal bridges and tails and are consistent with having already undergone a pericentre passage (see also Blumenthal et al. 2020). We find the projected nuclear separation to be 26.59 kpc which is consistent with the value of 27.2 ± 4.1 kpc quoted for the M2 stage by Larson et al. (2016) and with the separation of 26.2 kpc estimated by Yamada et al. (2021) reiterating that the galaxies are indeed undergoing a major merger. We computed a sSFR of 0.5 Gyr−1 for NGC 7469 and 0.1 Gyr−1 for the companion galaxy.
Our SED fitting results show SFR of ∼ 35/M⊙ yr−1 for the entire galaxy, whereas our photometric measurements show aggregated SFR of ∼ 1 − 2 M⊙/yr−1 since we masked the central SB, CND, and the AGN, and only considered the outer regions. This result is consistent in that most of the star formation in NGC 7469 is confined to a clumpy SB ring, but the star formation efficiency remains quite elevated even for the nuclear region that is most affected by the AGN (Zhang & Ho 2023).
Interactions are known to enhance the sSFR (Patton et al. 2020) and the enhancements extend to projected separations of 260 kpc (for physical distances it is 280 kpc), as seen in IllustrisTNG simulations (Nelson et al. 2019) and Sloan Digital Sky Survey (SDSS) galaxies. The projected distance, despite being a useful indicator does not give information on the actual distance between centres of the galaxies. Detailed dynamical simulation of the galaxy system will reveal more details about this particular system.
6. Summary
In this paper, we present detailed images of the galaxy pair NGC 7469 and IC 5283 in four wavelength bands of FUV and NUV, focussing mainly on the pair as a whole and the interaction among the galaxies. The galactic arms NGC 7469, in particular, the inner arm (also known as the outer ring) and the outer spiral arm are clearly visible in the composite image with a resolution that is better than the previous UV observations by GALEX and XMM-OM. We detected star-formation knots in the spiral arms of the galaxy NGC 7469, along with a few star-forming knots in the companion IC 5283.
We have presented the results of photometry of the star-forming regions in the spiral arms of the NGC 7469 and the star-forming knots in the companion IC 5283 based on the UVIT observations in various filters. These were analysed with the intention of studying the interaction between these galaxies using star-forming regions. We were able to identify a total of 51 SF regions, out of which 33 were new regions that could comprise star clusters, dense HII regions, and so on. Another 18 had been previously observed by various observing telescopes including HST, VLA, and Gemini. We see there is an enhanced star formation process in the outer arms which are towards the northwest side of the NGC 7469. Many star-forming knots are also present in IC 5283. This is consistent with the presence of interaction between these galaxies and this interaction may have triggered star formation in this arm.
To compare the star formation distributions in the two galaxies, we performed Kolmogorov-Smirnov tests. The results show very little differences of significance in the SFR distributions of NGC 7469 and IC 5283. There is some indication, however, that the interaction between the galaxies may have influenced their star formation processes differently. The surface brightness of NGC 7469 in the far-UV filters (F154W and F172M) and in one of the near-UV filters (N279N) is higher in the case of NGC 7469 compared to IC 5283 whereas surface brightness value in the N245M filter is comparable for both galaxies.
The stellar mass ratio of the galaxies confirms that they are undergoing a major merger. A comparison with simulations indicates that the current stage of the merger is post-first pericentre transit and simulations of the system will reveal the exact nature of the dynamics. It is to be noted that most of the SFR of the galaxy NGC 7469 is confined within the central SB ring, CND, and near the central AGN. However, the enhanced star formation in the outer regions is likely due to the merger. The results are consistent with previous observations and support the argument that these galaxies are indeed, interacting.
The SFR obtained for our interacting pair appears to be higher than that obtained in studies of other starburst galaxies. For example, a study by Wolter et al. (2023) for 30 galaxies found that the average SFR for the star-forming galaxies is around 8 − 9 M⊙ yr−1. Even galaxies in an interacting pair, namely, NGC 4676a/NGC 4676b, show an SFR of  for NGC 4676a and 2.3 M⊙ yr−1 for NGC 4676b based on FUV and mid-IR data. However, some interacting and colliding galaxies with ages in the range ∼100 MYr, such the galaxy pair NGC 2207/IC 2163, do show a higher SFR of 23.7 M⊙ yr−1 using X-ray data. Similarly, galaxies in another distant interacting pair, such as Arp 299 (NGC 3690/IC 694), show SFR of 75 M⊙ yr−1 using X-ray data.
Further investigations, such as spatial analysis and multi-wavelength studies, are warranted to better understand the specific mechanisms driving the similarity in star formation and to explore the implications for the overall evolution of these galaxies.
Distance of the SF regions from the central AGN is only calculated in the case of NGC 7469 as the identification of the centre in the case of IC 5283 is rather complex.
Acknowledgments
We thank the Indian Space Research Organisation for scheduling the observations within a short period of time and the Indian Space Science Data Centre (ISSDC) for making the data available. Kulinder Pal Singh thanks the Indian National Science Academy for support under the INSA Senior Scientist Programme. This work has been performed utilising the calibration databases and auxiliary analysis tools developed, maintained, and distributed by AstroSat-SXT team with members from various institutions in India and abroad and the SXT Payload Operation Center (POC) at the TIFR, Mumbai for the pipeline reduction. The work has also made use of software, and/or web tools obtained from NASA’s High Energy Astrophysics Science Archive Research Center (HEASARC), a service of the Goddard Space Flight Center and the Smithsonian Astrophysical Observatory. Abhinna Sundar Samantaray also thanks the Hector Fellow Academy (HFA) for the support with the research grants for a part of this project. AstroSat data for all the observations used in this paper are publicly available from the AstroSat archives maintained by the ISSDC, Bengaluru (https://astrobrowse.issdc.gov.in/astro_archive/archive/Home.jsp).
References
- Barnes, J. E., & Hernquist, L. 1992, ARA&A, 30, 705 [Google Scholar]
- Barton, E. J., Geller, M. J., & Kenyon, S. J. 2000, ApJ, 530, 660 [NASA ADS] [CrossRef] [Google Scholar]
- Bertin, E., & Arnouts, S. 1996, A&AS, 117, 393 [NASA ADS] [CrossRef] [EDP Sciences] [Google Scholar]
- Blumenthal, K. A., Moreno, J., Barnes, J. E., et al. 2020, MNRAS, 492, 2075 [CrossRef] [Google Scholar]
- Blustin, A. J., Branduardi-Raymont, G., Behar, E., et al. 2003, A&A, 403, 481 [NASA ADS] [CrossRef] [EDP Sciences] [Google Scholar]
- Calzetti, D. 2001, PASP, 113, 1449 [Google Scholar]
- Cazzoli, S., Gil de Paz, A., Márquez, I., et al. 2020, MNRAS, 493, 3656 [NASA ADS] [CrossRef] [Google Scholar]
- Charlot, S., & Fall, S. M. 2000, ApJ, 539, 718 [Google Scholar]
- da Cunha, E., & Charlot, S. 2011, MAGPHYS: Astrophysics Source Code Library [record ascl:1106.010] [Google Scholar]
- da Cunha, E., Charlot, S., & Elbaz, D. 2008, MNRAS, 388, 1595 [Google Scholar]
- da Cunha, E., Charmandaris, V., Díaz-Santos, T., et al. 2010, A&A, 523, A78 [NASA ADS] [CrossRef] [EDP Sciences] [Google Scholar]
- Davies, R. I., Tacconi, L. J., & Genzel, R. 2004, ApJ, 602, 148 [NASA ADS] [CrossRef] [Google Scholar]
- Davies, R. I., Müller Sánchez, F., Genzel, R., et al. 2007, ApJ, 671, 1388 [Google Scholar]
- Díaz, A. I., Álvarez, M. Á., Terlevich, E., et al. 2000, MNRAS, 311, 120 [CrossRef] [Google Scholar]
- Díaz-Santos, T., Alonso-Herrero, A., Colina, L., Ryder, S. D., & Knapen, J. H. 2007, ApJ, 661, 149 [CrossRef] [Google Scholar]
- Dopita, M. A., Pereira, M., Kewley, L. J., & Capaccioli, M. 2002, ApJS, 143, 47 [NASA ADS] [CrossRef] [Google Scholar]
- Dunne, L., Eales, S., Edmunds, M., et al. 2000, MNRAS, 315, 115 [Google Scholar]
- Elbaz, D., Dickinson, M., Hwang, H. S., et al. 2011, A&A, 533, A119 [NASA ADS] [CrossRef] [EDP Sciences] [Google Scholar]
- Forman, W., Jones, C., Cominsky, L., et al. 1978, ApJS, 38, 357 [Google Scholar]
- Gil de Paz, A., Boissier, S., Madore, B. F., et al. 2007, ApJS, 173, 185 [Google Scholar]
- Gil de Paz, A., Boissier, S., Madore, B. F., et al. 2009, VizieR Online Data Catalog: J/ApJS/173/185 [Google Scholar]
- Greene, J., Lim, J., & Ho, P. T. P. 2004, ApJS, 153, 93 [NASA ADS] [CrossRef] [Google Scholar]
- Hao, C.-N., Kennicutt, R. C., Johnson, B. D., et al. 2011, ApJ, 741, 124 [Google Scholar]
- Heckman, T. M., Hoopes, C. G., Seibert, M., et al. 2005, ApJ, 619, L35 [NASA ADS] [CrossRef] [Google Scholar]
- Hernquist, L. 1989, Nature, 340, 687 [Google Scholar]
- Hopkins, P. F., Hernquist, L., Cox, T. J., et al. 2006a, ApJS, 163, 1 [Google Scholar]
- Hopkins, P. F., Narayan, R., & Hernquist, L. 2006b, ApJ, 643, 641 [NASA ADS] [CrossRef] [Google Scholar]
- Iglesias-Páramo, J., Buat, V., Takeuchi, T. T., et al. 2006, ApJS, 164, 38 [CrossRef] [Google Scholar]
- Izumi, T., Kohno, K., Aalto, S., et al. 2015, ApJ, 811, 39 [NASA ADS] [CrossRef] [Google Scholar]
- Izumi, T., Nguyen, D. D., Imanishi, M., et al. 2020, ApJ, 898, 75 [NASA ADS] [CrossRef] [Google Scholar]
- Jarrett, T. H., Chester, T., Cutri, R., Schneider, S. E., & Huchra, J. P. 2003, AJ, 125, 525 [Google Scholar]
- Kelvin, L. S., Driver, S. P., Robotham, A. S. G., et al. 2014, MNRAS, 444, 1647 [Google Scholar]
- Kennicutt, R. C., Jr. 1998, ARA&A, 36, 189 [Google Scholar]
- Kennicutt, R. C., & Evans, N. J. 2012, ARA&A, 50, 531 [NASA ADS] [CrossRef] [Google Scholar]
- Kormendy, J., & Ho, L. C. 2013, ARA&A, 51, 511 [Google Scholar]
- Kormendy, J., & Kennicutt, R. C. Jr. 2004, ARA&A, 42, 603 [NASA ADS] [CrossRef] [Google Scholar]
- Kriss, G. A., Blustin, A., Branduardi-Raymont, G., et al. 2003, A&A, 403, 473 [NASA ADS] [CrossRef] [EDP Sciences] [Google Scholar]
- Kumar, S., Dewangan, G. C., Singh, K. P., et al. 2023, ApJ, 950, 90 [NASA ADS] [CrossRef] [Google Scholar]
- Kumari, K., Dewangan, G. C., Papadakis, I. E., et al. 2023, MNRAS, 521, 4109 [NASA ADS] [CrossRef] [Google Scholar]
- Laine, S., Kotilainen, J. K., Reunanen, J., Ryder, S. D., & Beck, R. 2006, AJ, 131, 701 [NASA ADS] [CrossRef] [Google Scholar]
- Landt, H., Bentz, M. C., Ward, M. J., et al. 2008, ApJS, 174, 282 [NASA ADS] [CrossRef] [Google Scholar]
- Larson, K. L., Sanders, D. B., Barnes, J. E., et al. 2016, ApJ, 825, 128 [Google Scholar]
- Leitherer, C. 2020, Galaxies, 8, 13 [NASA ADS] [CrossRef] [Google Scholar]
- Leitherer, C., Schaerer, D., Goldader, J. D., et al. 1999, ApJS, 123, 3 [Google Scholar]
- Lonsdale, C. J., Lonsdale, C. J., Smith, H. E., & Diamond, P. J. 2003, ApJ, 592, 804 [NASA ADS] [CrossRef] [Google Scholar]
- Marquez, I., & Moles, M. 1994, AJ, 108, 90 [CrossRef] [Google Scholar]
- Matteo, P. D., Combes, F., Melchior, A. L., & Semelin, B. 2008, in Pathways Through an Eclectic Universe, eds. J. H. Knapen, T. J. Mahoney, & A. Vazdekis, ASP Conf. Ser., 390, 178 [NASA ADS] [Google Scholar]
- Mehdipour, M., Kaastra, J. S., Costantini, E., et al. 2018, A&A, 615, A72 [NASA ADS] [CrossRef] [EDP Sciences] [Google Scholar]
- Moles, M., Marquez, I., & Perez, E. 1995, ApJ, 438, 604 [NASA ADS] [CrossRef] [Google Scholar]
- Murphy, E. J., Condon, J. J., Schinnerer, E., et al. 2011, ApJ, 737, 67 [Google Scholar]
- Nandi, P., Stalin, C. S., Saikia, D. J., et al. 2023, ApJ, 950, 81 [NASA ADS] [CrossRef] [Google Scholar]
- Nandra, K., Clavel, J., Edelson, R. A., et al. 1998, ApJ, 505, 594 [CrossRef] [Google Scholar]
- Nelson, D., Springel, V., Pillepich, A., et al. 2019, Comput. Astrophys. Cosmol., 6, 2 [Google Scholar]
- Nordon, R., Lutz, D., Shao, L., et al. 2010, A&A, 518, L24 [NASA ADS] [CrossRef] [EDP Sciences] [Google Scholar]
- Nordon, R., Lutz, D., Genzel, R., et al. 2012, ApJ, 745, 182 [NASA ADS] [CrossRef] [Google Scholar]
- Patton, D. R., Wilson, K. D., Metrow, C. J., et al. 2020, MNRAS, 494, 4969 [NASA ADS] [CrossRef] [Google Scholar]
- Pereira-Santaella, M., Alonso-Herrero, A., Santos-Lleo, M., et al. 2011, A&A, 535, A93 [NASA ADS] [CrossRef] [EDP Sciences] [Google Scholar]
- Pérez-González, P. G., Kennicutt, R. C. J., Gordon, K. D. et al., 2006, ApJ, 648, 987 [CrossRef] [Google Scholar]
- Pérez-Torres, M. A., Alberdi, A., Colina, L., et al. 2009, MNRAS, 399, 1641 [CrossRef] [Google Scholar]
- Postma, J. E., & Leahy, D. 2017, PASP, 129, 115002 [Google Scholar]
- Postma, J. E., & Leahy, D. 2021, JA&A, 42, 30 [NASA ADS] [Google Scholar]
- Rahna, P. T., Das, M., Murthy, J., Gudennavar, S. B., & Bubbly, S. G. 2018, MNRAS, 481, 1212 [Google Scholar]
- Ramos Almeida, C., Levenson, N. A., Alonso-Herrero, A., et al. 2011, ApJ, 731, 92 [Google Scholar]
- Ripepi, V., Cignoni, M., Tosi, M., et al. 2014, MNRAS, 442, 1897 [NASA ADS] [CrossRef] [Google Scholar]
- Sanders, D. B., & Mirabel, I. F. 1996, ARA&A, 34, 749 [Google Scholar]
- Sanders, D. B., Mazzarella, J. M., Kim, D. C., Surace, J. A., & Soifer, B. T. 2003, AJ, 126, 1607 [Google Scholar]
- Schlafly, E. F., & Finkbeiner, D. P. 2011, ApJ, 737, 103 [Google Scholar]
- Schweizer, F. 1982, ApJ, 252, 455 [Google Scholar]
- Scoville, N. Z., Evans, A. S., Thompson, R., et al. 2000, AJ, 119, 991 [NASA ADS] [CrossRef] [Google Scholar]
- Senchyna, P., Stark, D. P., Charlot, S., et al. 2021, MNRAS, 503, 6112 [NASA ADS] [CrossRef] [Google Scholar]
- Shiryayev, A. N. 1992, 15. On The Empirical Determination of A Distribution Law (Dordrecht: Springer, Netherlands), 139 [Google Scholar]
- Singh, K. P., Tandon, S. N., Agrawal, P. C., et al. 2014, in Space Telescopes and Instrumentation 2014: Ultraviolet to Gamma Ray, eds. T. Takahashi, J. W. A. den Herder, & M. Bautz, SPIE Conf. Ser., 9144, 91441S [NASA ADS] [Google Scholar]
- Sliwa, K., & Downes, D. 2017, A&A, 604, A2 [NASA ADS] [CrossRef] [EDP Sciences] [Google Scholar]
- Soifer, B. T., Bock, J. J., Marsh, K., et al. 2003, AJ, 126, 143 [CrossRef] [Google Scholar]
- Swain, S., Dewangan, G. C., Shalima, P., Tripathi, P., & Latha, K. V. P. 2023, MNRAS, 520, 3712 [NASA ADS] [CrossRef] [Google Scholar]
- Tandon, S. N., Subramaniam, A., Girish, V., et al. 2017, AJ, 154, 128 [NASA ADS] [CrossRef] [Google Scholar]
- Tandon, S. N., Postma, J., Joseph, P., et al. 2020, AJ, 159, 158 [Google Scholar]
- Toomre, A., & Toomre, J. 1972, ApJ, 178, 623 [Google Scholar]
- Ulvestad, J. S., Wilson, A. S., & Sramek, R. A. 1981, ApJ, 247, 419 [NASA ADS] [CrossRef] [Google Scholar]
- Vavilkin, T. 2011, PhD Thesis, SUNY Stony Brook, New York, USA [Google Scholar]
- Walcher, J., Groves, B., Budavári, T., & Dale, D. 2011, Ap&SS, 331, 1 [NASA ADS] [CrossRef] [Google Scholar]
- Wanders, I., Peterson, B. M., Alloin, D., et al. 1997, ApJS, 113, 69 [Google Scholar]
- Wang, L., Norberg, P., Gunawardhana, M. L. P., et al. 2016, MNRAS, 461, 1898 [Google Scholar]
- Wijesinghe, D. B., Hopkins, A. M., Sharp, R., et al. 2011, MNRAS, 410, 2291 [CrossRef] [Google Scholar]
- Wolter, I. E., Berg, M. A., & Chisholm, J. 2023, Res. Notes Am. Astron. Soc., 7, 232 [Google Scholar]
- Yamada, S., Ueda, Y., Tanimoto, A., et al. 2021, ApJS, 257, 61 [NASA ADS] [CrossRef] [Google Scholar]
- Yamada, S., Ueda, Y., Herrera-Endoqui, M., et al. 2023, ApJS, 265, 37 [NASA ADS] [CrossRef] [Google Scholar]
- Zhang, L., & Ho, L. C. 2023, ApJ, 953, L9 [CrossRef] [Google Scholar]
All Tables
Log of observations of the Seyfert Galaxy NGC 7469 and IC 5283 in the UVIT Filters.
SEXTRACTOR (version v1.2b14) parameters used for the analysis of the UVIT images.
Results obtained from Kolmogorov-Smirnov test for the comparison of SFR distributions in NGC 7469 and IC 5283 in different filters.
Integrated flux measurements for NGC 7469 and IC 5283 in different wavebands, in increasing order of wavelength from top to bottom.
Comparison of NGC 7469 and IC 5283 with respect to the physical parameters estimated with the SED fitted using the MAGPHYS code (da Cunha et al. 2008).
All Figures
|
Fig. 1. Composite RGB image of NGC 7469 created using the N245M (red), F172M (green), and F154W (blue), respectively (top). This image clearly shows the presence of inner spiral arms, and knots which act as evidence of the star formation occurring in the arms of the galaxy. A composite RGB image of NGC 7469 was created using the SDSS frames, SDSS-r(red), SDSS-g (green), and SDSS-u (blue) respectively (bottom). Clearly, the spiral arms are better resolved in the UVIT image, compared to the SDSS image. |
| In the text | |
|
Fig. 2. NGC 7469 and IC 5283 photometry showing the star-forming regions (in green ellipses) in the N245M, F154W, N279N, and F172M filters, identified with the help of SExtractor using the parameters given in Table 3. A similar SF region’s identification process was done for all the other UVIT filters, as noted in Sect. 4.2. |
| In the text | |
|
Fig. 3. Comparison between new and previously detected clumps plotted on the HST image available at https://esahubble.org/. The previous clumps and SF region detections are marked in black dots. We detected 51 unique SF regions identified using RA and Dec in all the UVIT filters. We identified 33 new SF regions which are shown in black crosses whereas the red open circles (enclosing black dots) represent the clumps and SF regions (18) that were detected both by the UVIT and had been observed previously. |
| In the text | |
|
Fig. 4. Distribution of areas of the SF regions detected by SExtractor in NGC 7469 and IC 5283 in various UVIT filters. |
| In the text | |
|
Fig. 5. Distribution of SFR of NGC 7469 and IC 5283 in various UVIT filters. |
| In the text | |
|
Fig. 6. Star-forming regions (see Fig. 2) of the galaxy NGC 7469 (N245M filter) divided by the areas – R1 and R2 containing northern and southern arms, respectively (left). The measurements of the box size and division are provided in Sect. 4.2.3. North is up and west is left. The plot showing the distance from the central AGN as a function of flux values (in μJy) of the star-forming regions (refer the electronically available Tables) in the R1 and R2 areas is shown by blue squares and red circles, respectively, in various UVIT filters (right). The green line is the median flux value of the SF regions in those filters. It clearly shows the enhanced star-formation process occurring in the R1 region suggesting that the interaction might have occurred along that arm. |
| In the text | |
|
Fig. 7. Integrated UV to NIR spectral energy distribution (SED) of the galaxies NGC 7469 and IC 5283. In this two-panel plot, the top panel shows the photometric data from Table 5 for the two galaxies are shown as yellow dots which were used to fit a SED using the code MAGPHYS (da Cunha & Charlot 2011). The blue dashed line represents the unabsorbed stellar component, while the red dashed lines show the dust re-emission. The black solid line represents the total emission. The bottom panel shows the residuals concerning the best fit. The parameters χ2 and zs represent the chi-square of the best-fit model and the redshift of the galaxy, respectively. Table 6 provides the extracted physical parameters derived from this SED fitting. |
| In the text | |
Current usage metrics show cumulative count of Article Views (full-text article views including HTML views, PDF and ePub downloads, according to the available data) and Abstracts Views on Vision4Press platform.
Data correspond to usage on the plateform after 2015. The current usage metrics is available 48-96 hours after online publication and is updated daily on week days.
Initial download of the metrics may take a while.