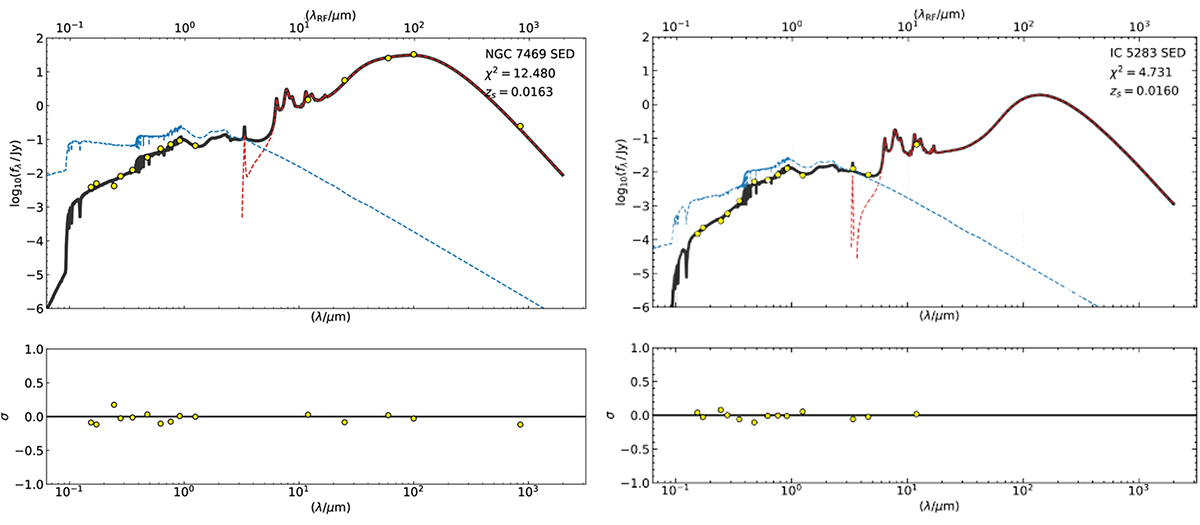
Fig. 7.
Download original image
Integrated UV to NIR spectral energy distribution (SED) of the galaxies NGC 7469 and IC 5283. In this two-panel plot, the top panel shows the photometric data from Table 5 for the two galaxies are shown as yellow dots which were used to fit a SED using the code MAGPHYS (da Cunha & Charlot 2011). The blue dashed line represents the unabsorbed stellar component, while the red dashed lines show the dust re-emission. The black solid line represents the total emission. The bottom panel shows the residuals concerning the best fit. The parameters χ2 and zs represent the chi-square of the best-fit model and the redshift of the galaxy, respectively. Table 6 provides the extracted physical parameters derived from this SED fitting.
Current usage metrics show cumulative count of Article Views (full-text article views including HTML views, PDF and ePub downloads, according to the available data) and Abstracts Views on Vision4Press platform.
Data correspond to usage on the plateform after 2015. The current usage metrics is available 48-96 hours after online publication and is updated daily on week days.
Initial download of the metrics may take a while.