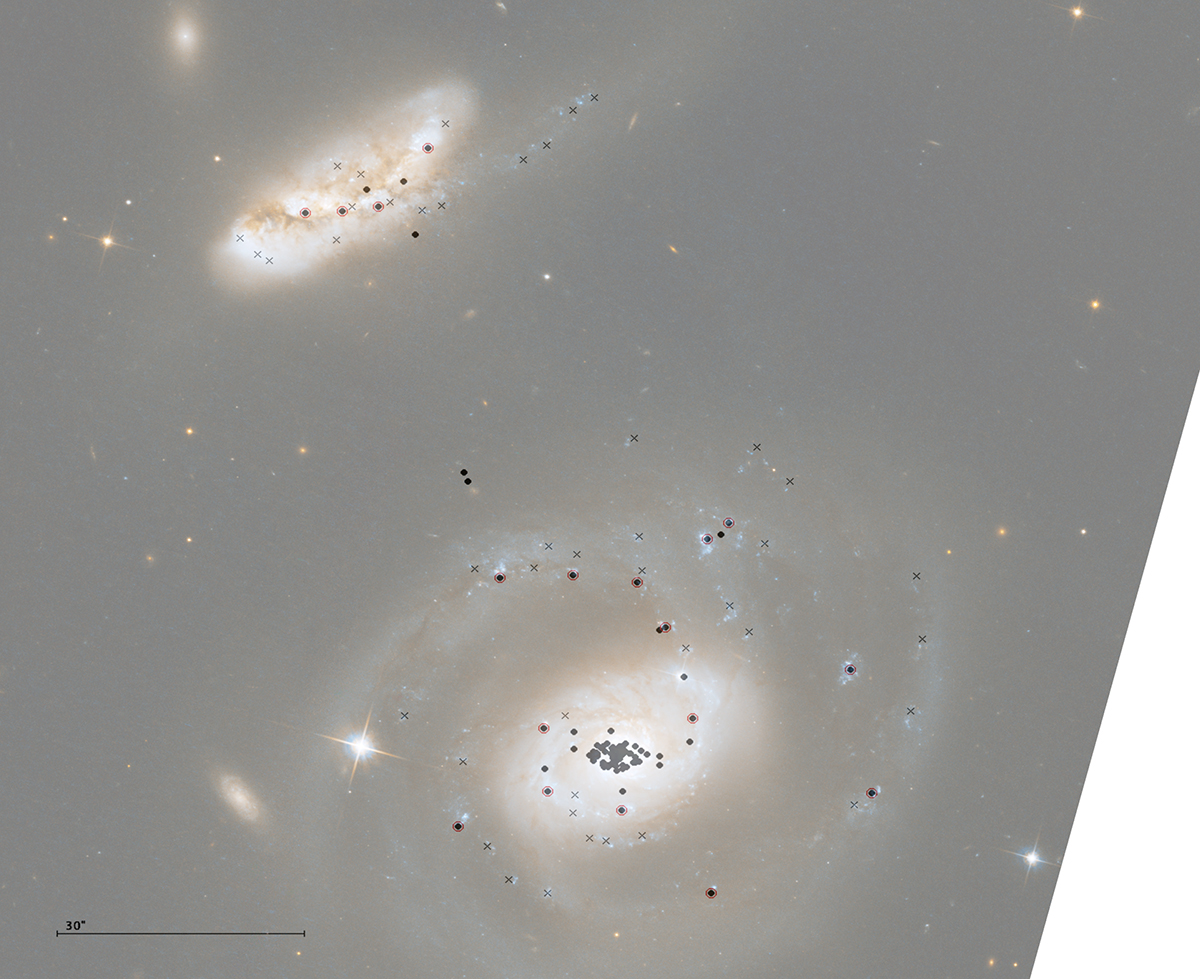
Fig. 3.
Download original image
Comparison between new and previously detected clumps plotted on the HST image available at https://esahubble.org/. The previous clumps and SF region detections are marked in black dots. We detected 51 unique SF regions identified using RA and Dec in all the UVIT filters. We identified 33 new SF regions which are shown in black crosses whereas the red open circles (enclosing black dots) represent the clumps and SF regions (18) that were detected both by the UVIT and had been observed previously.
Current usage metrics show cumulative count of Article Views (full-text article views including HTML views, PDF and ePub downloads, according to the available data) and Abstracts Views on Vision4Press platform.
Data correspond to usage on the plateform after 2015. The current usage metrics is available 48-96 hours after online publication and is updated daily on week days.
Initial download of the metrics may take a while.