Fig. 6.
Download original image
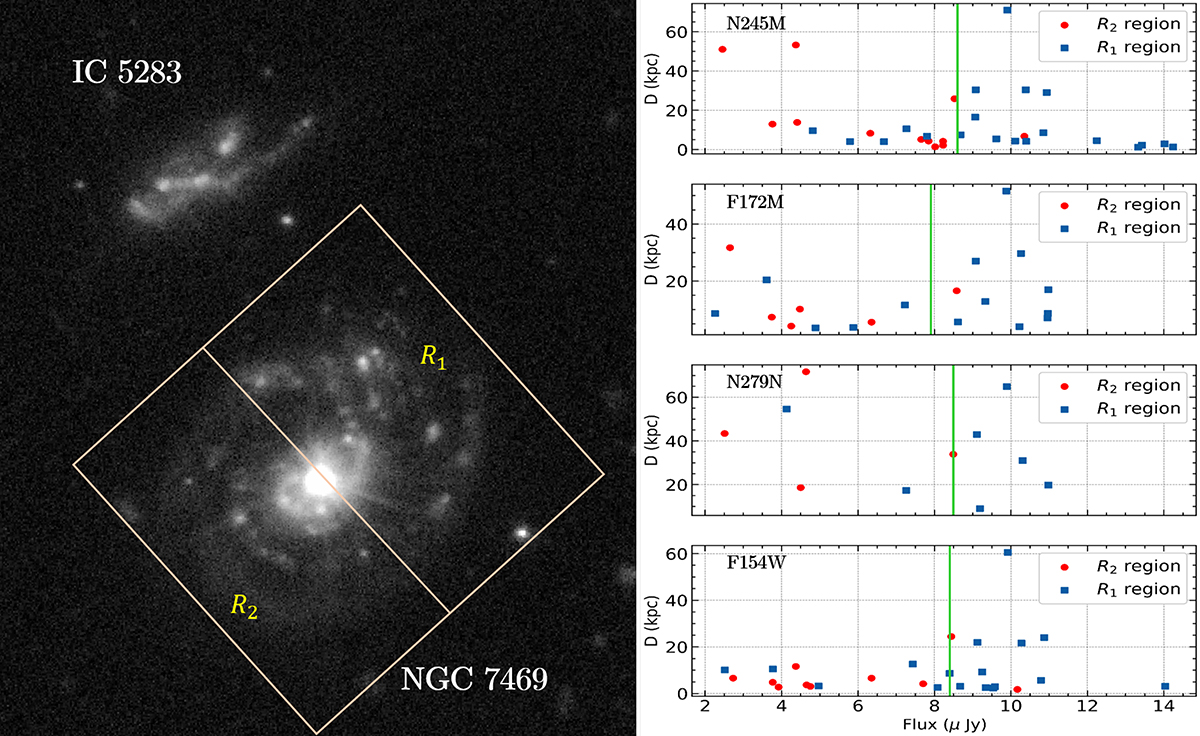
Star-forming regions (see Fig. 2) of the galaxy NGC 7469 (N245M filter) divided by the areas – R1 and R2 containing northern and southern arms, respectively (left). The measurements of the box size and division are provided in Sect. 4.2.3. North is up and west is left. The plot showing the distance from the central AGN as a function of flux values (in μJy) of the star-forming regions (refer the electronically available Tables) in the R1 and R2 areas is shown by blue squares and red circles, respectively, in various UVIT filters (right). The green line is the median flux value of the SF regions in those filters. It clearly shows the enhanced star-formation process occurring in the R1 region suggesting that the interaction might have occurred along that arm.
Current usage metrics show cumulative count of Article Views (full-text article views including HTML views, PDF and ePub downloads, according to the available data) and Abstracts Views on Vision4Press platform.
Data correspond to usage on the plateform after 2015. The current usage metrics is available 48-96 hours after online publication and is updated daily on week days.
Initial download of the metrics may take a while.