Fig. 15
Download original image
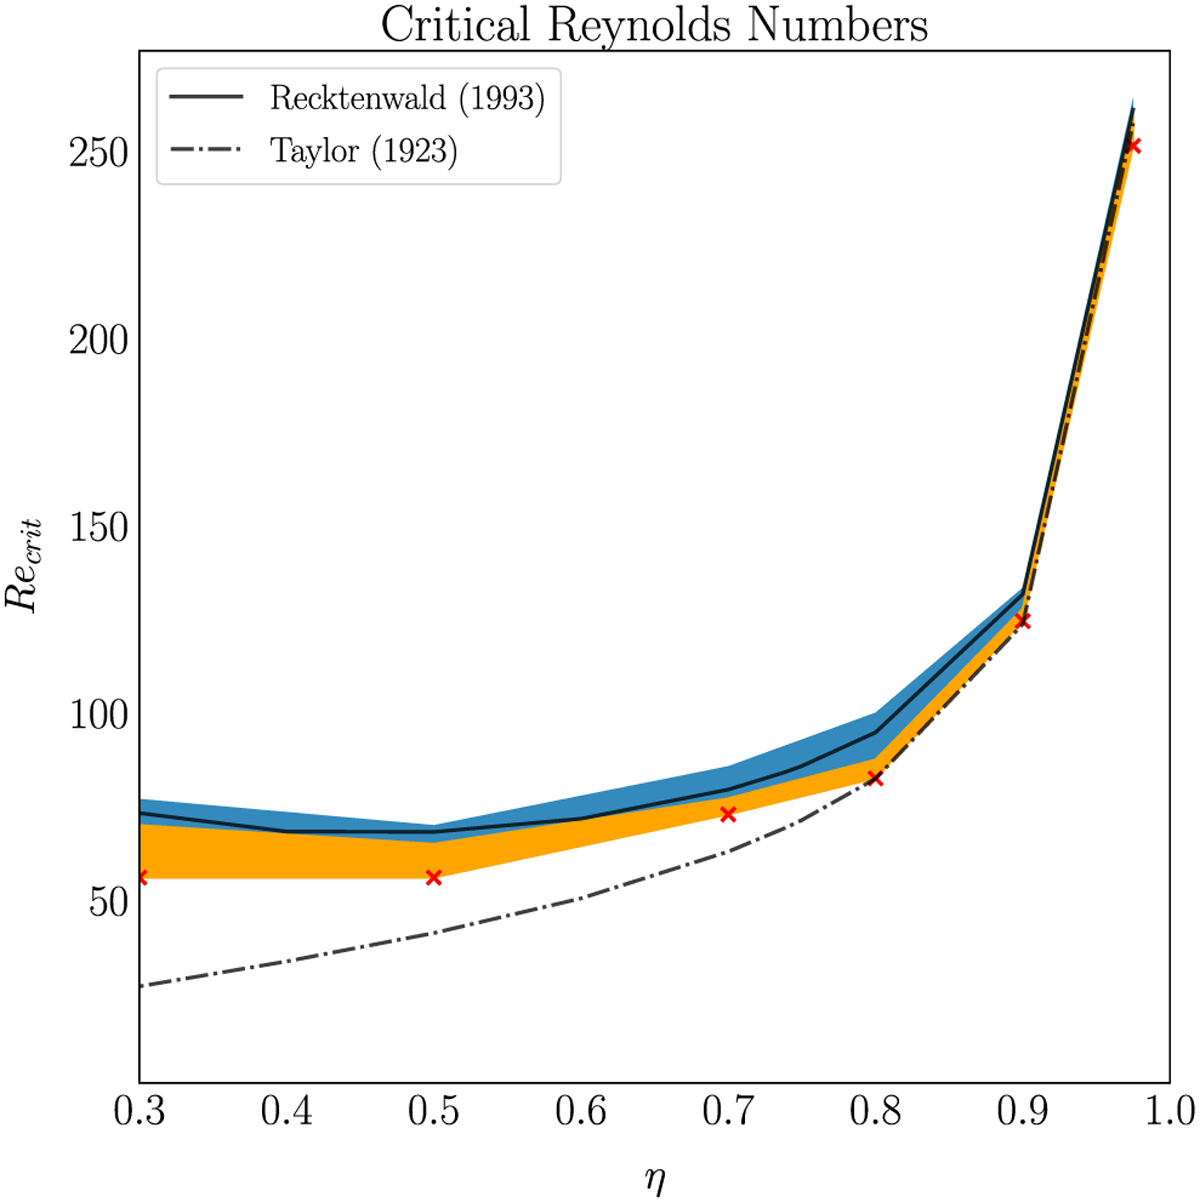
Experimentally derived ranges for the critical Reynolds numbers in the TC test problem for different radius ratios using high-resolution simulations to two viscous timescales (blue) and low-resolution simulations to 2000 viscous timescales (orange) in comparison to predictions by Recktenwald et al. (1993) (solid line) and Taylor (1923) (dotted line). The orange area marks the range where instability is obtained exclusively from the lower-resolution runs and no instability for the higher-resolution runs was found. The red crosses mark the position of the lowest value of the critical Reynolds number for the respective radius ratio that was obtained.
Current usage metrics show cumulative count of Article Views (full-text article views including HTML views, PDF and ePub downloads, according to the available data) and Abstracts Views on Vision4Press platform.
Data correspond to usage on the plateform after 2015. The current usage metrics is available 48-96 hours after online publication and is updated daily on week days.
Initial download of the metrics may take a while.