Fig. 1
Download original image
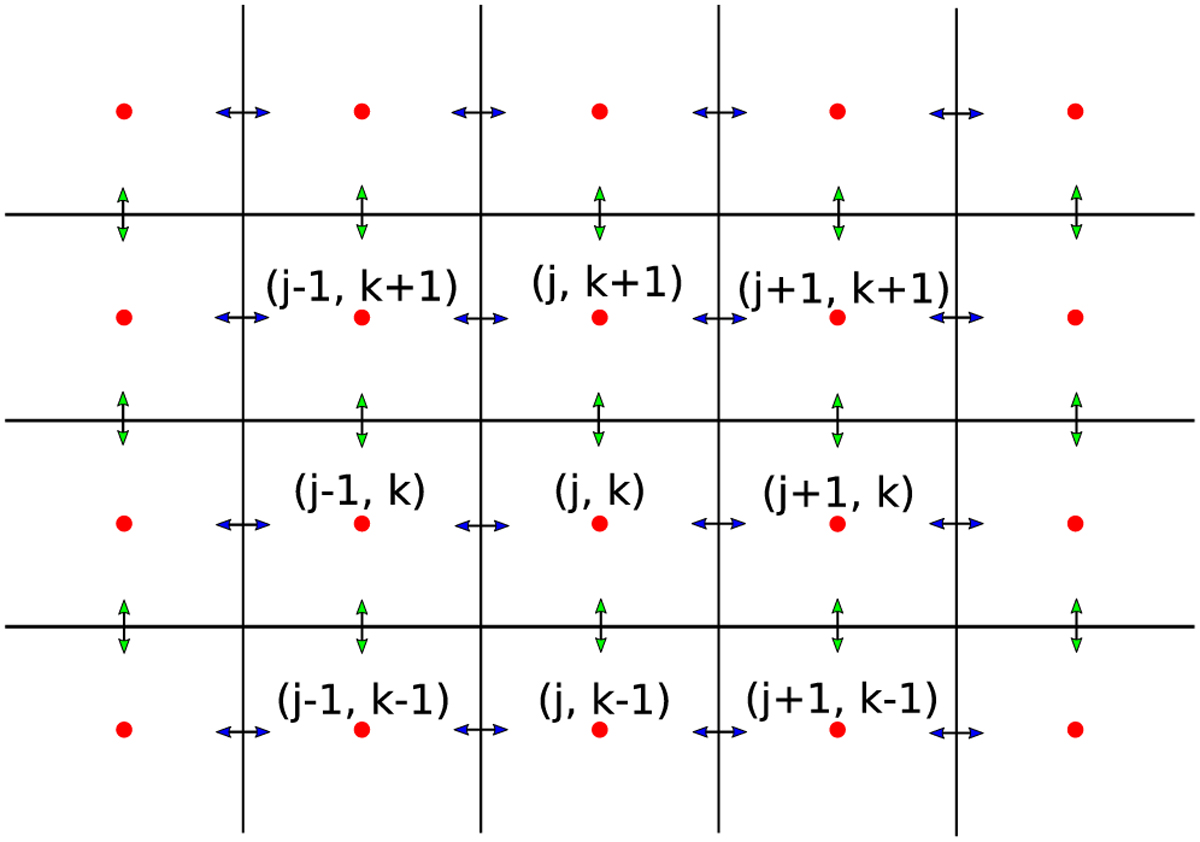
Illustration of staggered grid. Scalar properties are defined at the locations of the red dots in the center of each cell. The x, R, r component of the velocity is located at the interfaces marked with blue arrows and the y, ɀ, θ component of the velocity is calculated at the interaces marked by green arrows. Counting is indicated by the index k in the vertical or polar direction and j in the horizontal or radial direction. The location of variables at cell centers is expressed with integer indices and at cell faces with the integer ![]() notation.
notation.
Current usage metrics show cumulative count of Article Views (full-text article views including HTML views, PDF and ePub downloads, according to the available data) and Abstracts Views on Vision4Press platform.
Data correspond to usage on the plateform after 2015. The current usage metrics is available 48-96 hours after online publication and is updated daily on week days.
Initial download of the metrics may take a while.