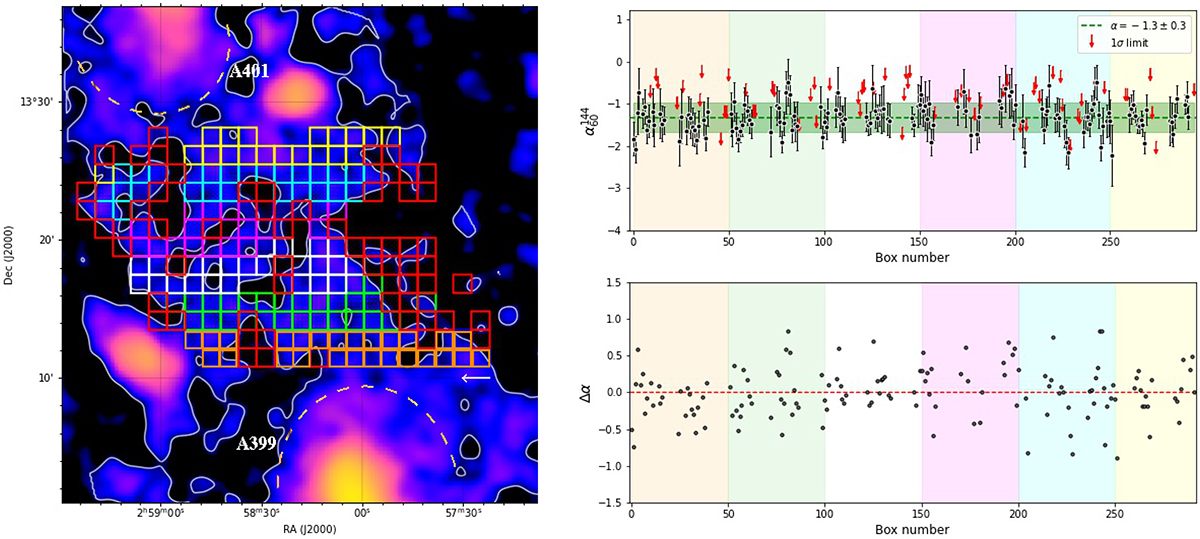
Fig. 4.
Download original image
Spectral index distribution. Left panel: LBA radio image at 60 MHz and resolution of 80″. The 2σrms contours and the grid to extract the spectral index between 60 and 144 MHz are overlaid. Different areas of the bridge are covered by differently coloured cells. The coloured cells cover the LBA emission above 2σrms, and the red cells cover the 1σrms LBA emission and 2σrms HBA emission. Top right: spectral index distribution across the bridge. The black points show values extracted from each cell, separated by colour, and the red arrows indicate 1σrms limits extracted from the red cells. The dashed horizontal green line shows the mean spectral index, and the filled horizontal green region represents the standard deviation. Bottom right: distribution of residuals (Δα) of α with respect to the mean spectral index.
Current usage metrics show cumulative count of Article Views (full-text article views including HTML views, PDF and ePub downloads, according to the available data) and Abstracts Views on Vision4Press platform.
Data correspond to usage on the plateform after 2015. The current usage metrics is available 48-96 hours after online publication and is updated daily on week days.
Initial download of the metrics may take a while.