Fig. 3.
Download original image
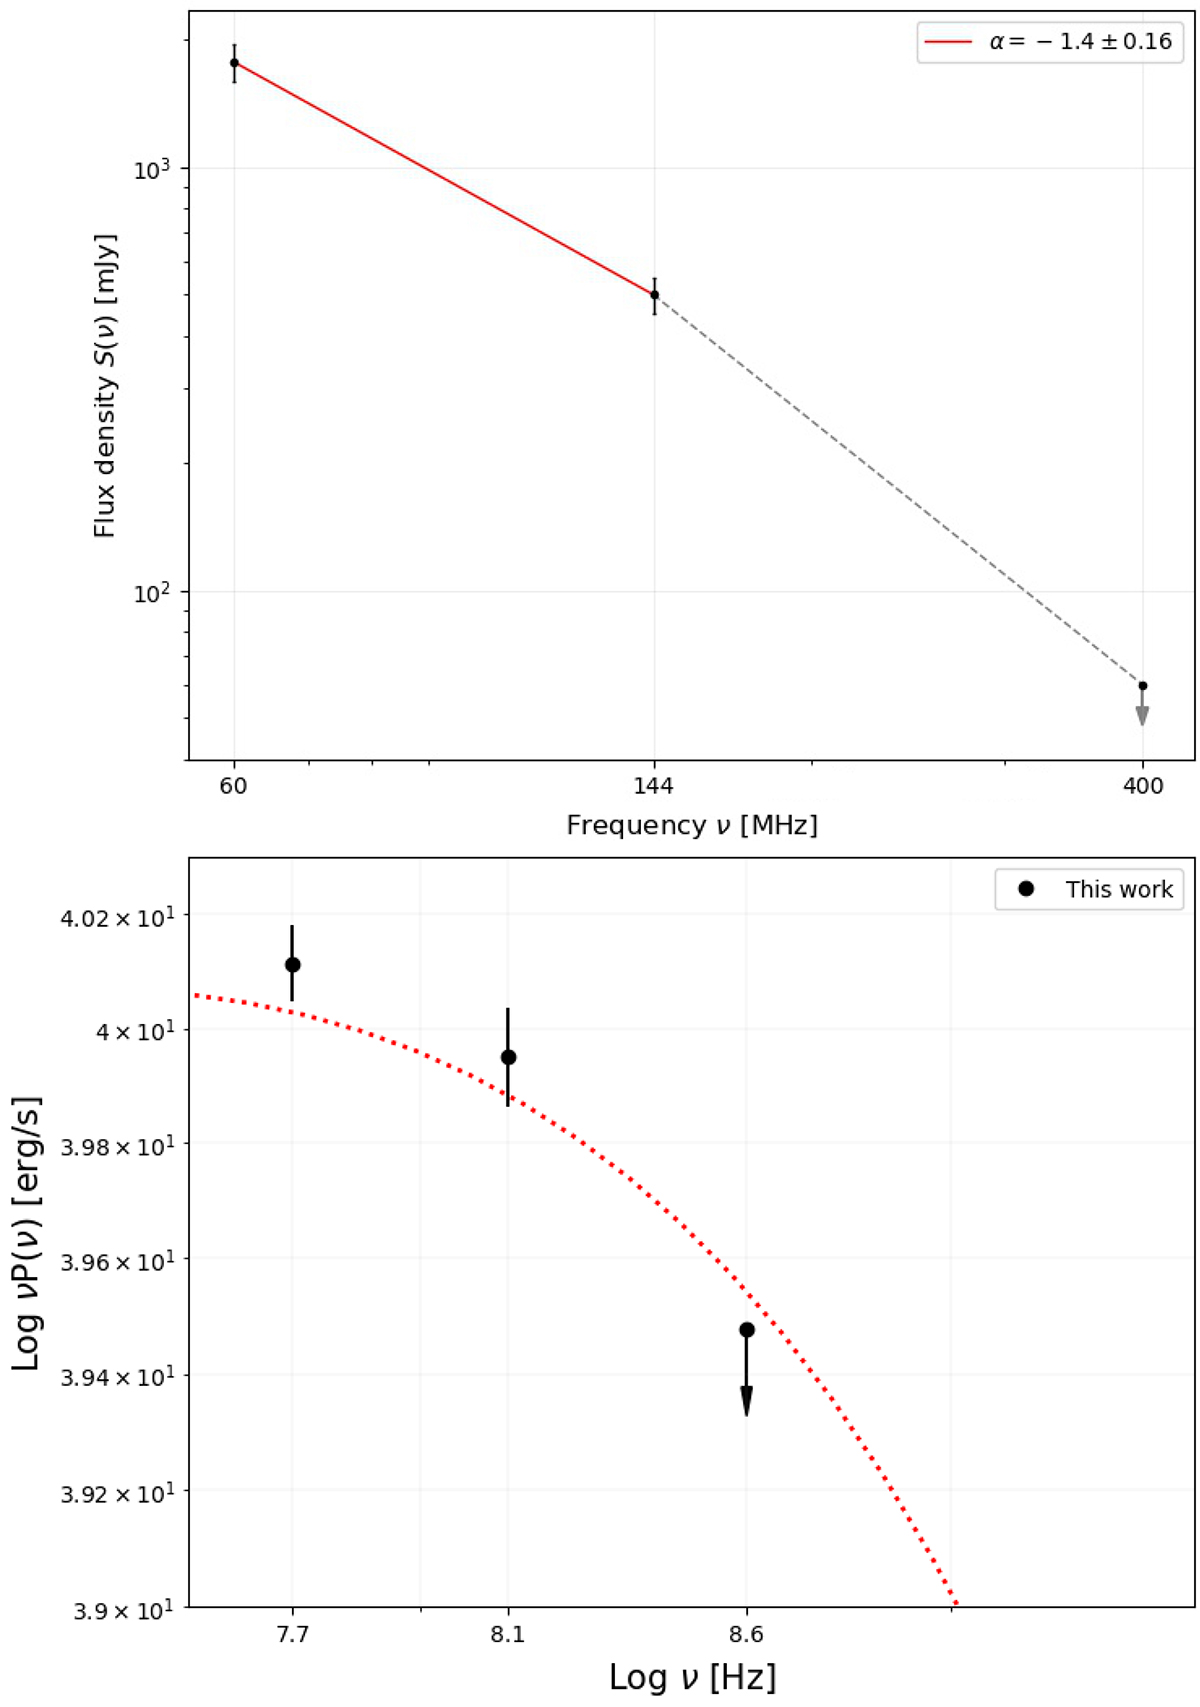
Radio spectra. Top panel: bridge emission radio spectra in integrated flux density. The grey arrow represents the uGMRT limit. Bottom panel: radio luminosity of the bridge emission compared to a synchrotron theoretical model (red curve) produced by the relativistic particle populations with acceleration times τacc > 200 Myr.
Current usage metrics show cumulative count of Article Views (full-text article views including HTML views, PDF and ePub downloads, according to the available data) and Abstracts Views on Vision4Press platform.
Data correspond to usage on the plateform after 2015. The current usage metrics is available 48-96 hours after online publication and is updated daily on week days.
Initial download of the metrics may take a while.