Fig. 2.
Download original image
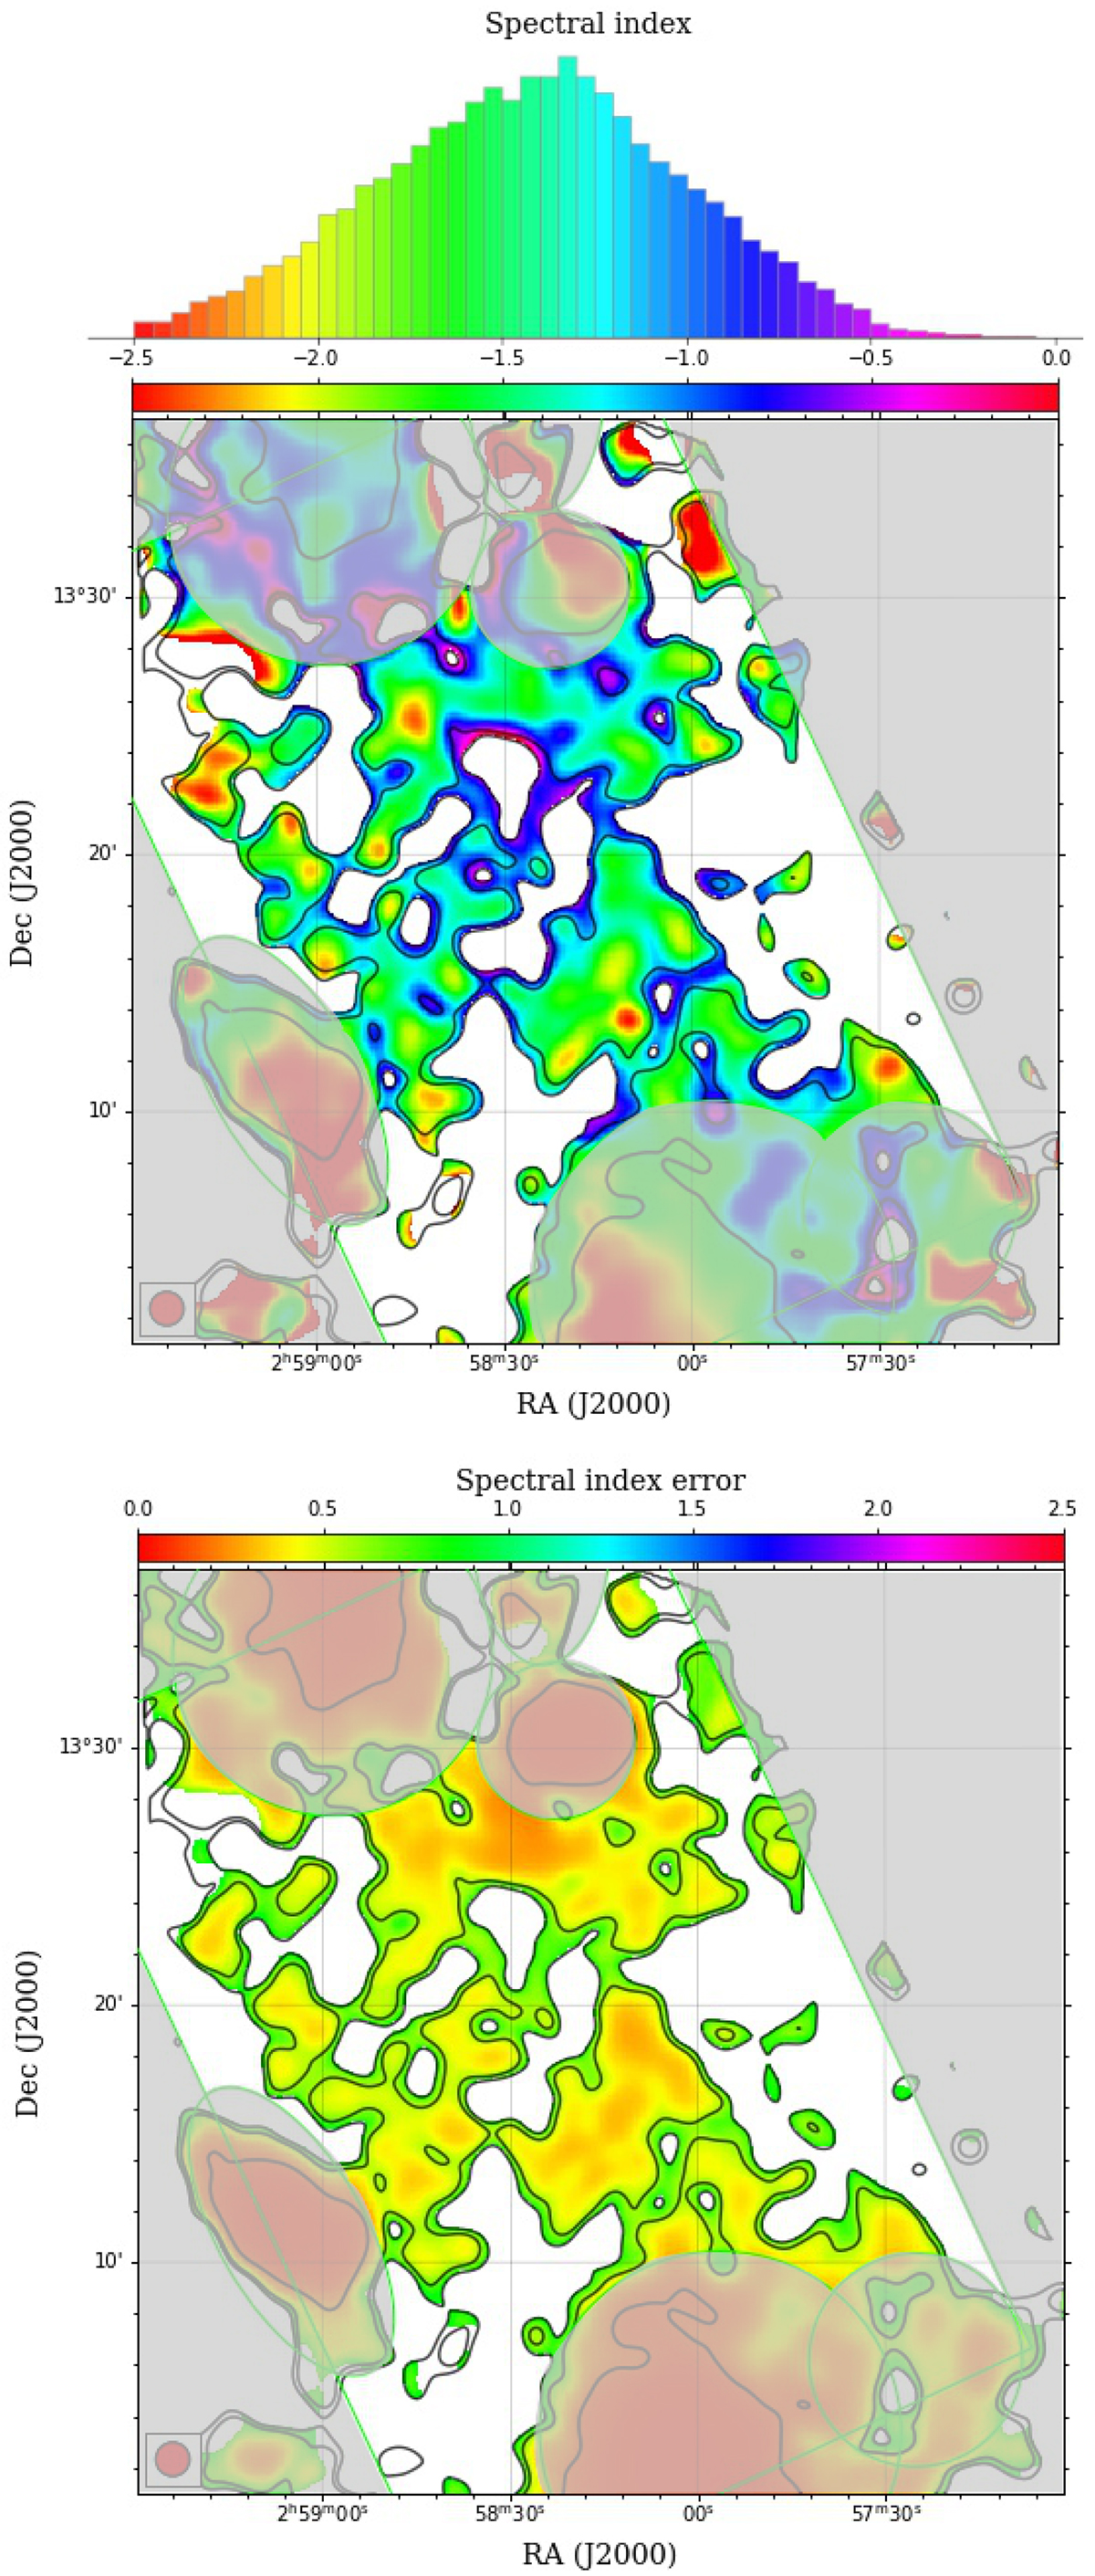
Spectral index maps. Top panel: spectral index map of the emission in the radio bridge in A399–A401 between 60 and 144 MHz, with a resolution of 80″. The distribution of the spectral index values (histogram at the top) only refers to the bridge emission inside the 2σrms level, which is not covered by the grey mask over the radio haloes. Bottom panel: associated spectral index error map. The LOFAR LBA contours at 2σrms and 3σrms are overlaid in black.
Current usage metrics show cumulative count of Article Views (full-text article views including HTML views, PDF and ePub downloads, according to the available data) and Abstracts Views on Vision4Press platform.
Data correspond to usage on the plateform after 2015. The current usage metrics is available 48-96 hours after online publication and is updated daily on week days.
Initial download of the metrics may take a while.