Fig. 1.
Download original image
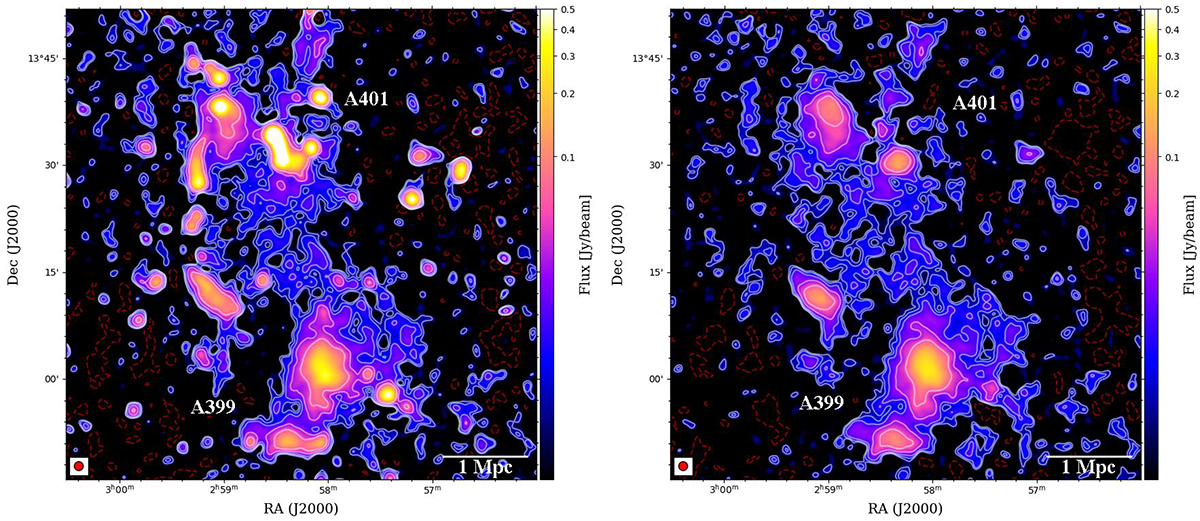
Radio images at 60 MHz of the A399–A401 clusters pair. Left panel: low-resolution (75″, the beam size is indicated in the bottom left corner) image with compact sources and the σrms = 3 mJy beam−1 produced with the parameters listed in Table 1. Right panel: same as the left panel, but after subtraction of the compact source. The contour levels (in white) start at 2σrms, 3σrms, and 5σrms and then increase to 20σrms with factors of 2. A negative contour at −3σrms is shown in red.
Current usage metrics show cumulative count of Article Views (full-text article views including HTML views, PDF and ePub downloads, according to the available data) and Abstracts Views on Vision4Press platform.
Data correspond to usage on the plateform after 2015. The current usage metrics is available 48-96 hours after online publication and is updated daily on week days.
Initial download of the metrics may take a while.