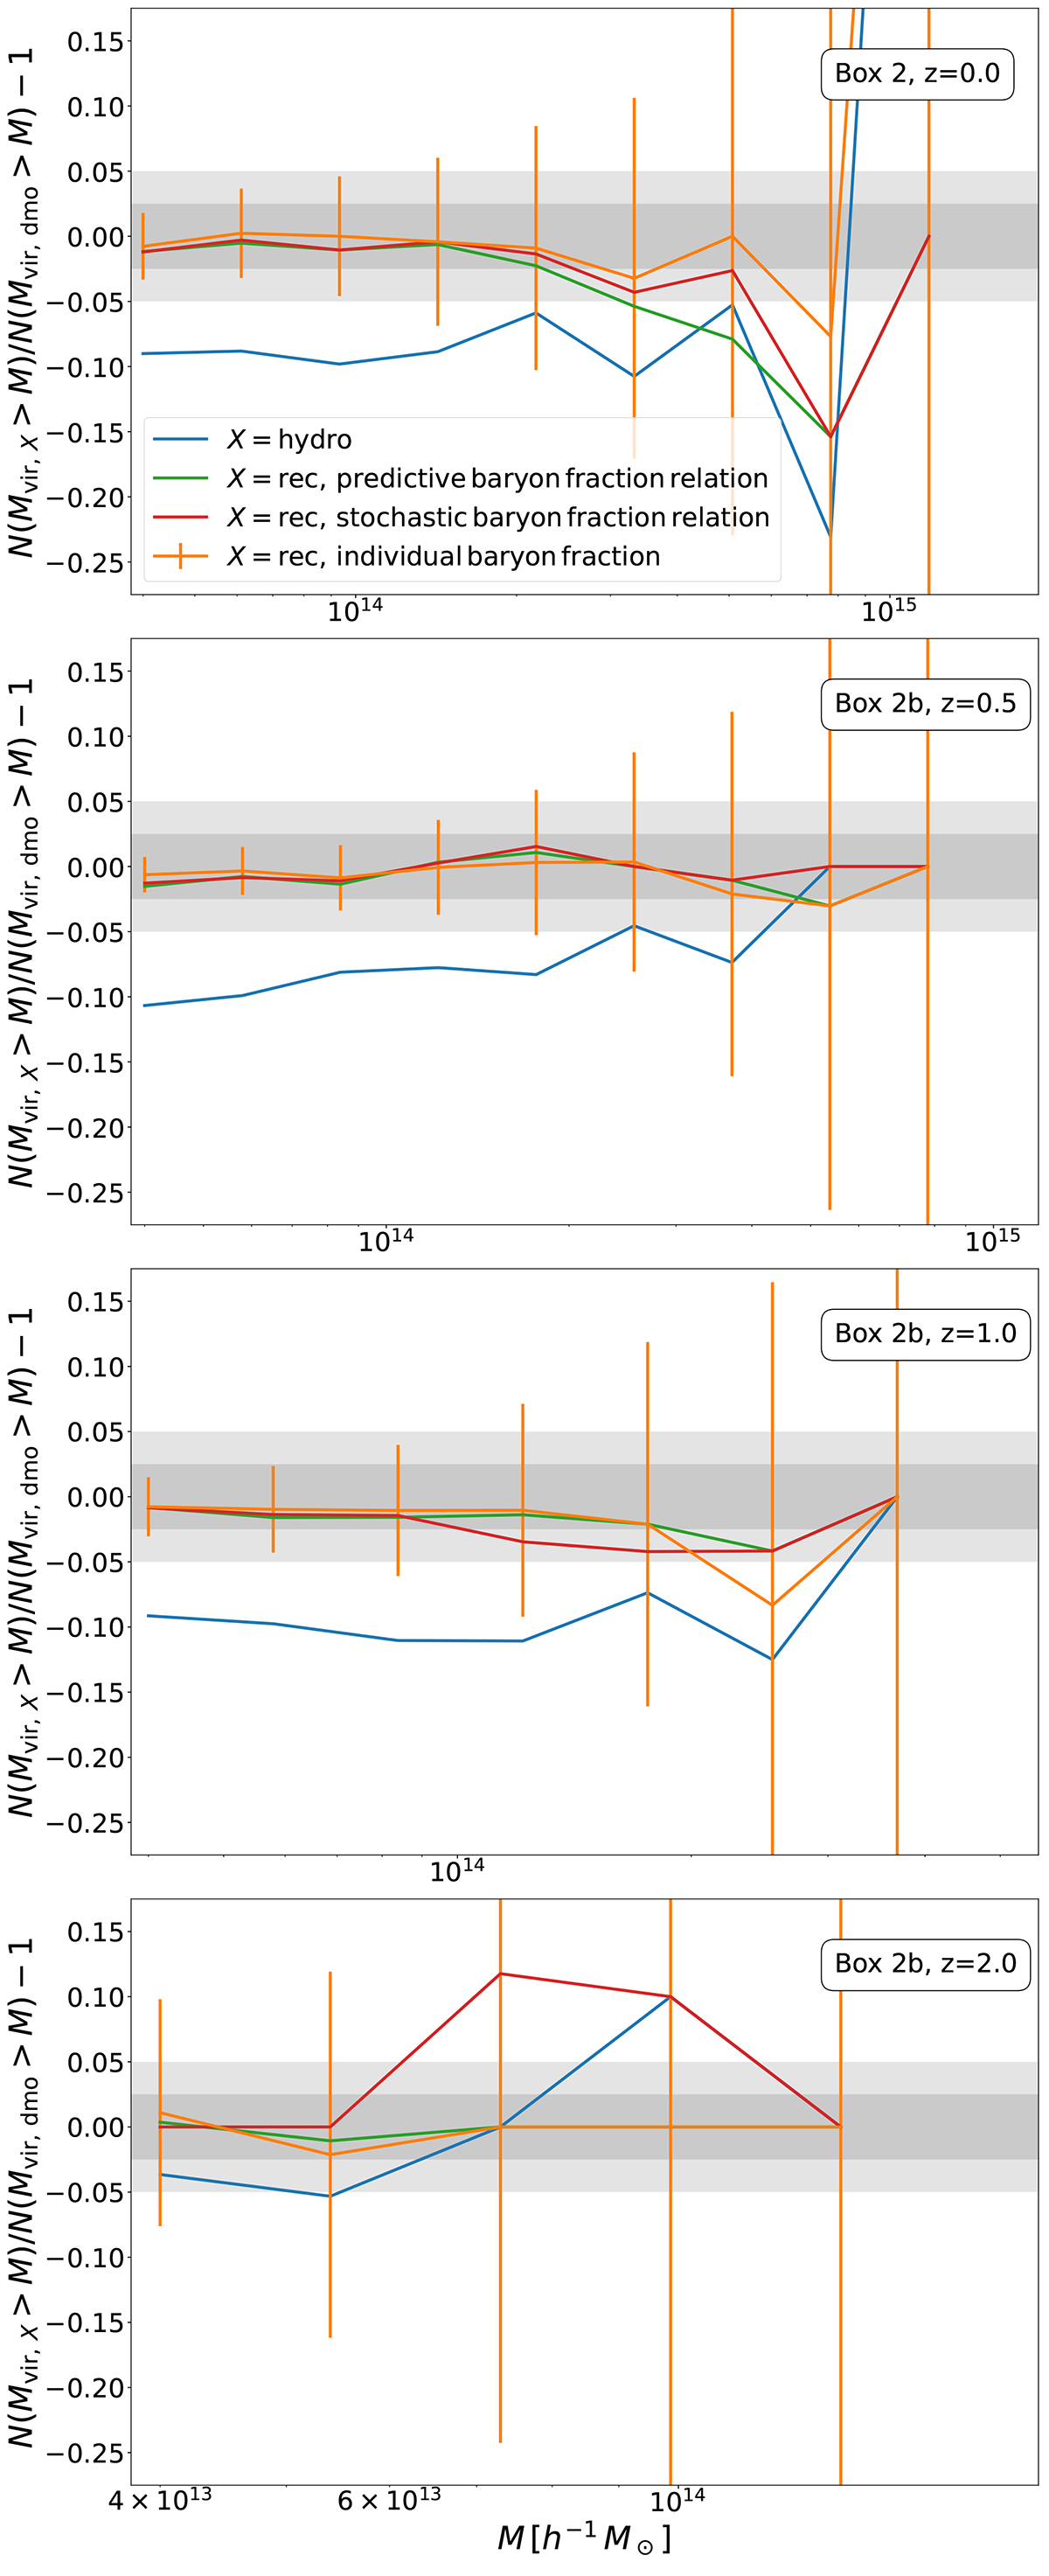
Fig. 9.
Download original image
Ratio of the cumulative halo abundance in the hydro simulation to the halo abundance of virial halos in the dmo simulation. The results are shown for the simulated virial mass and the prediction of our model based on the individual baryon fractions, a predictive baryon fraction relation, and a stochastic baryon fraction relation. Error bars are displayed for the first case, assuming uncorrelated Poisson errors. Different panels correspond to redshifts z ∈ {0.0, 0.5, 1.0, 2.0} using Magneticum Box 2b, except for z = 0.0, where Box 2 is used. The grey regions correspond to 2.5 and 5 percent.
Current usage metrics show cumulative count of Article Views (full-text article views including HTML views, PDF and ePub downloads, according to the available data) and Abstracts Views on Vision4Press platform.
Data correspond to usage on the plateform after 2015. The current usage metrics is available 48-96 hours after online publication and is updated daily on week days.
Initial download of the metrics may take a while.