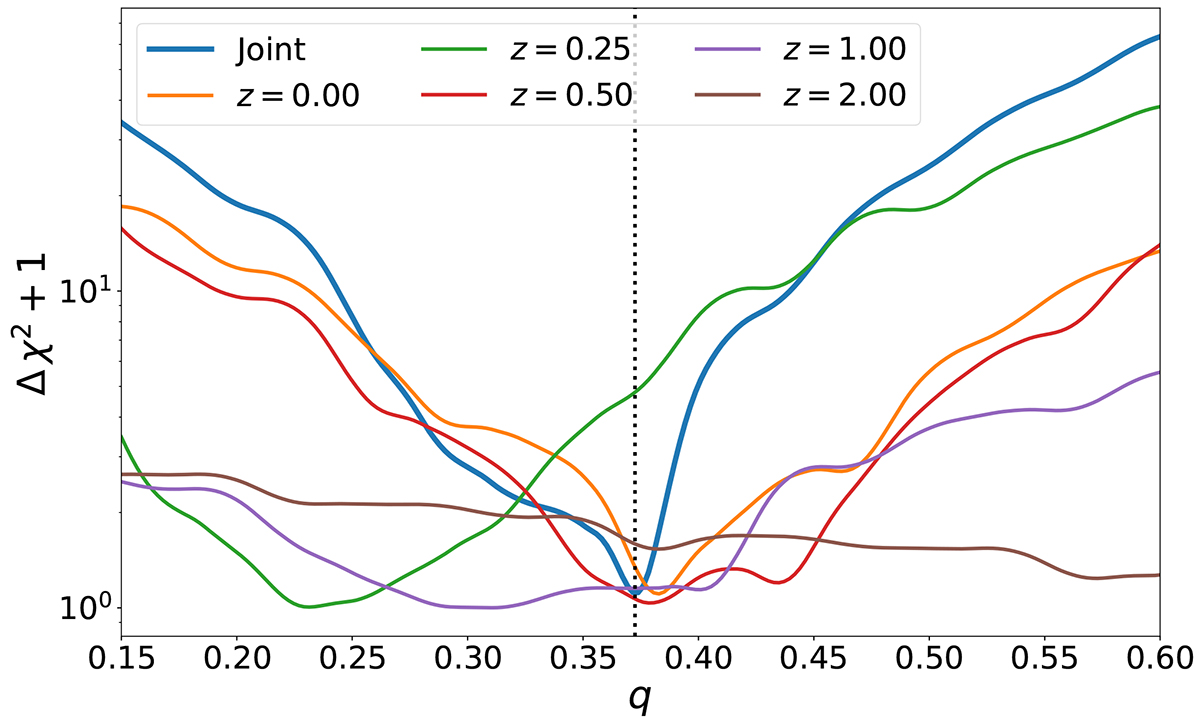
Fig. 3.
Download original image
Variation of the χ2 with respect to its minimum, as a function of the quasi-adiabatic parameter q for the model presented in Sect. 2. We present the results for the joint analysis of five redshifts z ∈ {0.00, 0.25, 0.50, 1.00, 2.00} from the Magneticum Box 2 simulation, as well as the results at each redshift. The best fit for q = 0.373 is marked with the vertical dashed line.
Current usage metrics show cumulative count of Article Views (full-text article views including HTML views, PDF and ePub downloads, according to the available data) and Abstracts Views on Vision4Press platform.
Data correspond to usage on the plateform after 2015. The current usage metrics is available 48-96 hours after online publication and is updated daily on week days.
Initial download of the metrics may take a while.