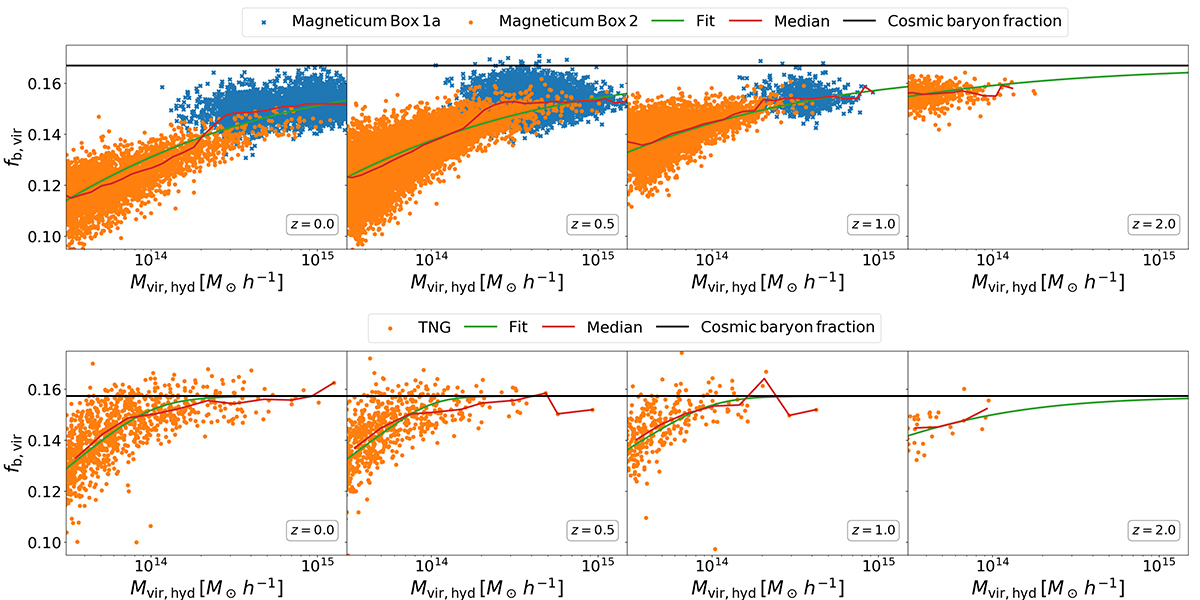
Fig. A.1.
Download original image
Baryon fraction inside the virial radius as a function of the virial mass. Top: Magneticum suite of simulations. Orange and blue symbols correspond to Box 2 and Box 1a, respectively. Bottom: TNG300 simulation. Different columns correspond to the redshifts z ∈ {0.0, 0.5, 1.0, 2.0}. The assumed cosmic baryon fraction for each simulation is depicted as the horizontal black line.
Current usage metrics show cumulative count of Article Views (full-text article views including HTML views, PDF and ePub downloads, according to the available data) and Abstracts Views on Vision4Press platform.
Data correspond to usage on the plateform after 2015. The current usage metrics is available 48-96 hours after online publication and is updated daily on week days.
Initial download of the metrics may take a while.