Open Access
Fig. A.1
Download original image
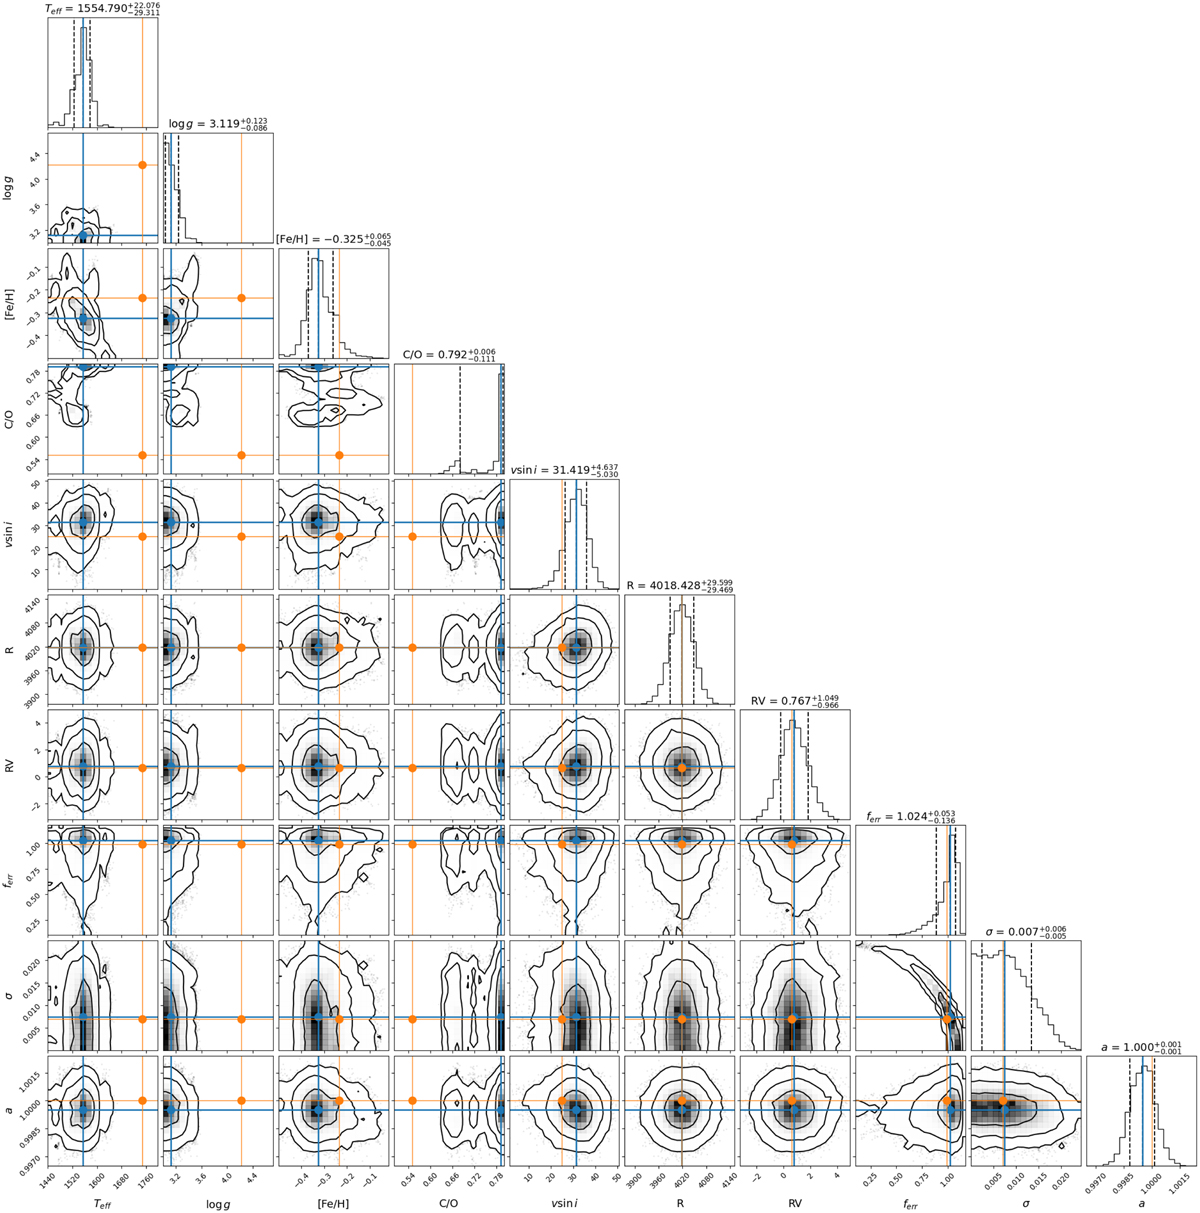
Corner plot summarising the MCMC results for the fit of the β Pic b IR SINFONI spectrum by Exo-REM models with all free parameters. The blue lines and dot show the median parameters. The orange lines and dot are those found for the preferred solution (see Section 6.2).
Current usage metrics show cumulative count of Article Views (full-text article views including HTML views, PDF and ePub downloads, according to the available data) and Abstracts Views on Vision4Press platform.
Data correspond to usage on the plateform after 2015. The current usage metrics is available 48-96 hours after online publication and is updated daily on week days.
Initial download of the metrics may take a while.