Open Access
Fig. 16
Download original image
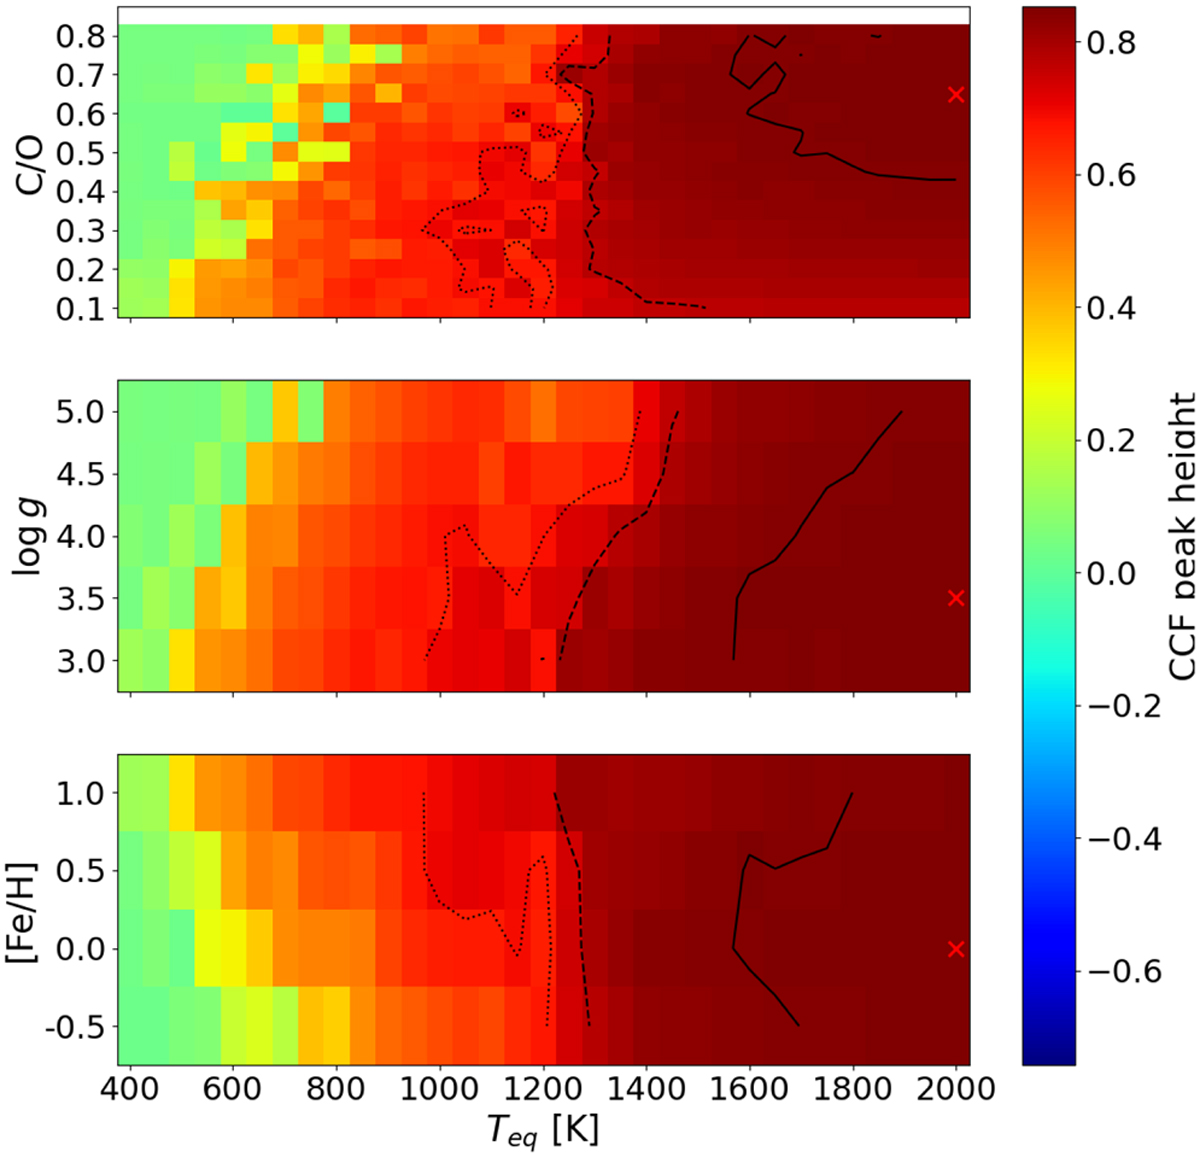
Grid search CCF maps for Tefflog g (top panel) Teff-C/0 (middle panel), and Teff-]Fe/H]. The solid, dashed, and dotted lines indicate 1%, 10%, and 20% ∆CCF levels compared to the optimal CCF. The red cross indicates the optimum model.
Current usage metrics show cumulative count of Article Views (full-text article views including HTML views, PDF and ePub downloads, according to the available data) and Abstracts Views on Vision4Press platform.
Data correspond to usage on the plateform after 2015. The current usage metrics is available 48-96 hours after online publication and is updated daily on week days.
Initial download of the metrics may take a while.