Fig. 2.
Download original image
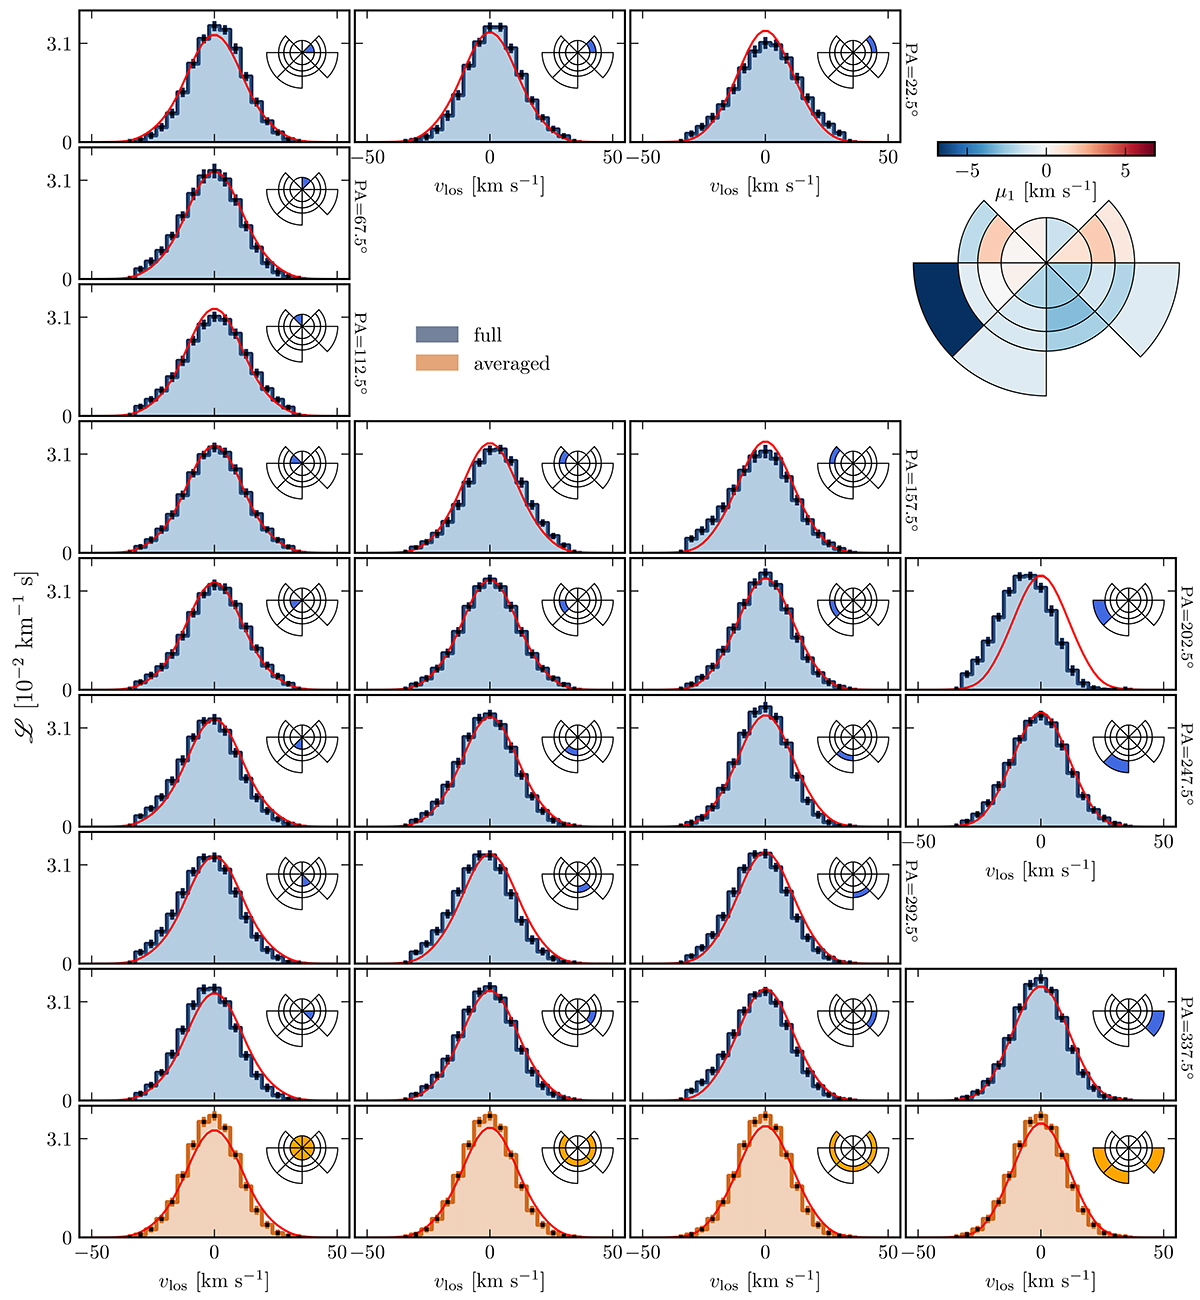
LOSVDs from BR21 (colored histograms) compared to those from the median models (red curves). The columns, from left to right, show LOSVDs computed at progressively larger radii. Rows, from top to bottom, show LOSVDs computed at increasing position angles. The bottom row (in orange) displays LOSVDs from BR21 weighted along the position angle of each radius. The top-right part of the figure shows the spatial distribution of the LOSVDs, color-coded for the offset velocity.
Current usage metrics show cumulative count of Article Views (full-text article views including HTML views, PDF and ePub downloads, according to the available data) and Abstracts Views on Vision4Press platform.
Data correspond to usage on the plateform after 2015. The current usage metrics is available 48-96 hours after online publication and is updated daily on week days.
Initial download of the metrics may take a while.