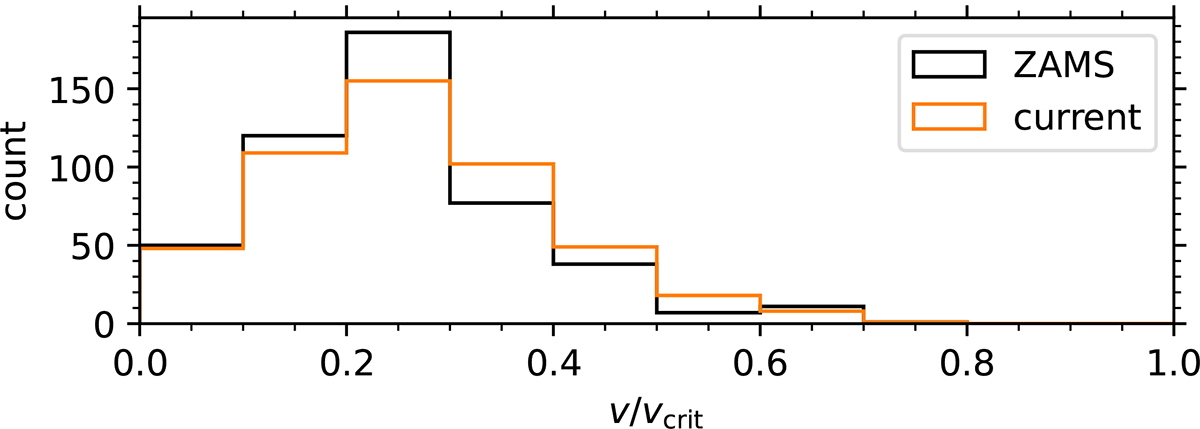
Fig. 6.
Download original image
Distributions of rotation rates as a fraction of the critical rotation (v/vcrit). The black distribution shows the back-traced initial rotation (at ZAMS). It is compared to the current distribution (orange) as derived from the asteroseismic grid modelling. The stars exhibit slightly larger fractions of the critical rotation velocity with respect to their initial rotation, as expected from the population seen in Fig. 5.
Current usage metrics show cumulative count of Article Views (full-text article views including HTML views, PDF and ePub downloads, according to the available data) and Abstracts Views on Vision4Press platform.
Data correspond to usage on the plateform after 2015. The current usage metrics is available 48-96 hours after online publication and is updated daily on week days.
Initial download of the metrics may take a while.