Fig. 4.
Download original image
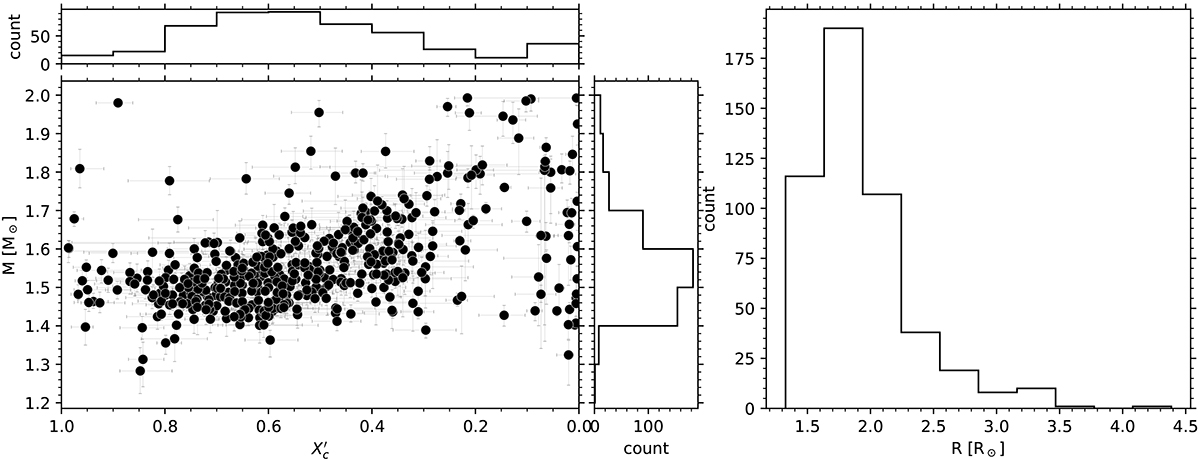
Distributions of the grid modelling results. Left: asteroseismic mass against the normalised core hydrogen mass fraction, ![]() . We find the majority of stars to have masses between 1.4 and 1.7 M⊙ and to be in the first part of their main-sequence evolution with
. We find the majority of stars to have masses between 1.4 and 1.7 M⊙ and to be in the first part of their main-sequence evolution with ![]() . Note that the
. Note that the ![]() -axis is inverted to represent the time evolution from left to right. Right: radius distribution of our sample. We find only a few evolved stars, and most stars have a radius between 1.5 and 2.2 R⊙, as expected in this mass regime for main-sequence stars.
-axis is inverted to represent the time evolution from left to right. Right: radius distribution of our sample. We find only a few evolved stars, and most stars have a radius between 1.5 and 2.2 R⊙, as expected in this mass regime for main-sequence stars.
Current usage metrics show cumulative count of Article Views (full-text article views including HTML views, PDF and ePub downloads, according to the available data) and Abstracts Views on Vision4Press platform.
Data correspond to usage on the plateform after 2015. The current usage metrics is available 48-96 hours after online publication and is updated daily on week days.
Initial download of the metrics may take a while.