Fig. 2.
Download original image
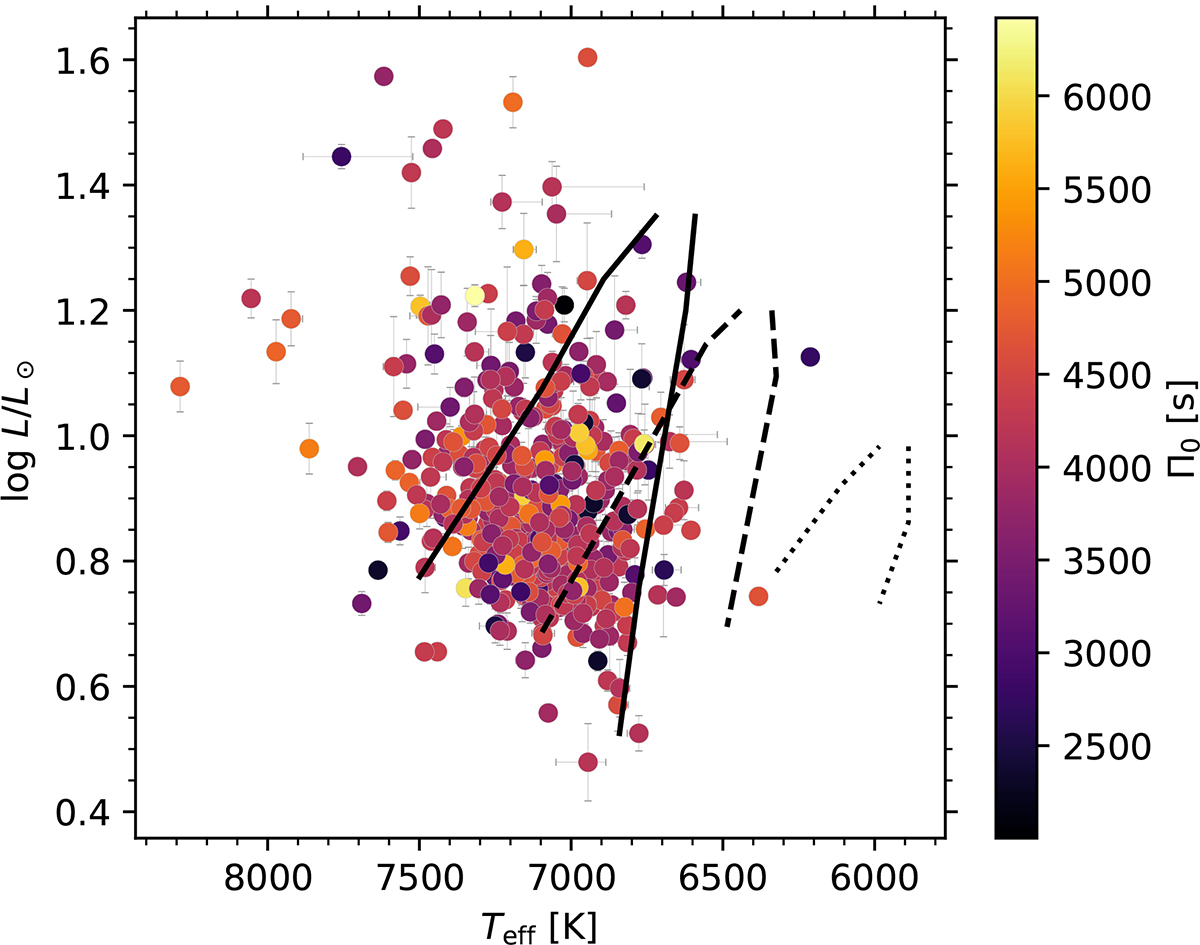
Hertzsprung-Russell diagram of our final sample, which contains 490 γ Dor stars. The colour-coding gives the Π0, which is used as an input parameter in the grid modelling. The solid lines indicate the theoretical γ Dor instability strip from Dupret et al. (2005) with a mixing-length parameter αMLT = 2, while the dashed and dotted lines show the position of the instability strip for αMLT = 1.5 and αMLT = 1, respectively.
Current usage metrics show cumulative count of Article Views (full-text article views including HTML views, PDF and ePub downloads, according to the available data) and Abstracts Views on Vision4Press platform.
Data correspond to usage on the plateform after 2015. The current usage metrics is available 48-96 hours after online publication and is updated daily on week days.
Initial download of the metrics may take a while.