| Issue |
A&A
Volume 684, April 2024
|
|
|---|---|---|
| Article Number | A168 | |
| Number of page(s) | 12 | |
| Section | Interstellar and circumstellar matter | |
| DOI | https://doi.org/10.1051/0004-6361/202348874 | |
| Published online | 22 April 2024 | |
Multiband reflectance and shadowing of the protoplanetary disk RX J1604.3-2130 in scattered light★
1
School of Physics and Astronomy, Sun Yat-sen University,
Zhuhai, Guangdong
519082,
PR China
e-mail: This email address is being protected from spambots. You need JavaScript enabled to view it.
2
Center of CSST in the great bay area, Sun Yat-sen University,
Zhuhai, Guangdong
519082,
PR China
3
Université Côte d’Azur, Observatoire de la Côte d’Azur, CNRS,
Laboratoire Lagrange, Bd de l’Observatoire, CS 34229,
06304
Nice Cedex 4,
France
e-mail: This email address is being protected from spambots. You need JavaScript enabled to view it.
4
Université Grenoble Alpes, CNRS, Institut de Planétologie et d’Astrophysique (IPAG),
38000
Grenoble,
France
5
Department of Astronomy, California Institute of Technology,
MC 249-17, 1200 E California Blvd,
Pasadena,
CA
91125,
USA
6
Department of Physics and Astronomy, The Johns Hopkins University,
3701 San Martin Drive,
Baltimore,
MD
21218,
USA
7
Aix-Marseille Univ., CNRS, CNES, LAM,
Marseille,
France
8
Institute for Particle Physics and Astrophysics, ETH Zürich,
Wolfgang Pauli Strasse 17,
8093
Zurich,
Switzerland
9
Earth and Planets Laboratory, Carnegie Institution for Science,
Washington,
DC
20015,
USA
10
Division of Geological & Planetary Sciences, California Institute of Technology,
MC 150-21,
Pasadena,
CA
91125,
USA
11
Jet Propulsion Laboratory, California Institute of Technology,
4800 Oak Grove Dr,
Pasadena,
CA
91109,
USA
Received:
7
December
2023
Accepted:
8
February
2024
Abstract
Context. A spatially resoved circumstellar disk spectrum and composition can provide valuable insights into the bulk composition of forming planets and into the mineralogical signatures that emerge during and after planet formation.
Aims. We systemically extracted the RX J1604.3-213010 (J1604 hereafter) protoplanetary disk in high-contrast imaging observations and obtained its multi-band reflectance in the visible to near-infrared wavelengths.
Methods. We obtained coronagraphic observations of J1604 from the Keck Observatory NIRC2 instrument and archival data from the Very Large Telescope SPHERE instrument. Using archival images to remove star light and speckles, we recovered the J1604 disk and obtained its surface brightness using forward modeling. Together with polarization data, we obtained the relative reflectance of the disk in R, J, H (H2 and H3), K (K1 and K2), and L′ bands spanning 2 yr.
Results. Relative to the J1604 star, the resolved disk has a reflectance of ~10−1 arcsec−2 in R through H bands and ~10−2 arcsec−2 in K and L′ bands, showing a blue color. Together with other systems, we summarized the multiband reflectance for nine systems. We also identified a varying disk geometry structure, and a shadow that vanished between June and August in 2015.
Conclusions. Motivated by broadband observations, the deployment of the latest technologies could yield higher-resolution reflection spectra, thereby informing the dust composition of disks in scattered light in the future. With multi-epoch observations, variable shadows have the potential to deepen our insight into the dynamic characteristics of inner disk regions.
Key words: techniques: high angular resolution / planets and satellites: detection / protoplanetary disks / stars: imaging
A copy of the reduced images is available at the CDS via anonymous ftp to cdsarc.cds.unistra.fr (130.79.128.5) or via https://cdsarc.cds.unistra.fr/viz-bin/cat/J/A+A/684/A168
Marie Skodowska-Curie Fellow.
© The Authors 2024
 Open Access article, published by EDP Sciences, under the terms of the Creative Commons Attribution License (https://creativecommons.org/licenses/by/4.0), which permits unrestricted use, distribution, and reproduction in any medium, provided the original work is properly cited.
This article is published in open access under the Subscribe to Open model. This email address is being protected from spambots. You need JavaScript enabled to view it. to support open access publication.
1 Introduction
Over 5000 exoplanets have been found with different observational techniques to date1, and the diversity in their size and mass distribution demonstrates the variety of the formation and evolution processes of planetary systems. Planets are formed within circumstellar disks around stars, implying that all are made from gas and dust inherited from the same molecular cloud. They could thus share a similar bulk composition (e.g., Wang et al. 2020a), suggesting that the composition of planets, disks, and stars is correlated. However, planets can form from different mechanisms, primarily through core accretion (e.g., Pollack et al. 1996) and disk gravitational instability (e.g., Pollack et al. 1996; Piso & Youdin 2014; Piso et al. 2015), and these models predict different planetary luminosity and spectra (e.g., Spiegel & Burrows 2012). An investigation into the compositional makeup of planetary systems, including planets and disks, can contribute to our understanding of these celestial bodies, offering an opportunity to empirically test the prevailing theories of planet formation.
Various indirect techniques were proposed to infer the bulk composition ofexoplanets. Typically, mass-radius measurements of exoplanets are employed to estimate the bulk composition of the planet (e.g., Zeng et al. 2019; Miller & Fortney 2011; Thorngren et al. 2016; Müller et al. 2020; Plotnykov & Valencia 2020; Adibekyan et al. 2021). The uncertainties in exoplanet property measurements, including radius and mass, are large, however (e.g., Weiss & Marcy 2014). In addition, the uncertainty or the degeneracy from theory predictions is significant (Müller et al. 2020; Müller & Helled 2023; Rogers & Seager 2010; Dressing et al. 2015). Consequently, they cannot precisely constrain the bulk composition of exoplanets.
Planet migration plays a decisive role in the evolution of rings and planets: The remnant planetesimal belts are candidates for cold debris disks (e.g., Jiang & Ormel 2023). Morbidelli et al. (2016) showed that accretion processes play a major role in determining the bulk composition and volatile budget of a planet. In the case of young planets that are still embedded in protoplanetary disks, it might therefore be possible to probe the planetary composition by obtaining the dust composition of the disks with a speculative hypothesis about migration and precise numerical simulations of accretion (Pacetti et al. 2022; Mah et al. 2023). Therefore, extracting the disk composition might contribute to the confirmation of the composition of exoplanets. The characterization of the initial elemental budget contained in the protoplanetary disks from which giant planets are born could thus provide constraints to inform planet formation models (Turrini et al. 2021; Pacetti et al. 2022).
Existing studies have attempted to infer the potential composition of circumstellar disks (e.g., protoplanetary, debris). With broadband photometry, Debes et al. (2008) found that the HR 4796 debris ring might be explained using grains with a radius of 1.4 µmof complex organic material; Rodigas et al. (2015) found that silicates and organics are more generally favored over water ice for HR 4796, which showed the possible existence of common constituents of both interstellar and Solar System comets. Using integral field spectroscopy, Bhowmik et al. (2019) observed HD 32297 with Spectro-Polarimetric High-contrast Exoplanet REsearch (SPHERE; Beuzit et al. 2019) in the Y, J, and H bands in total intensity and found that the spectral reflectance of the debris disk features a gray to blue color. They interpreted it as resulting from grains far below the blowout size. With a dip observed at the ice feature around 3.1 µm, certain young disks showed the potential presence of water ice, including HD 142527 (Honda et al. 2009), HD 100546 (Honda et al. 2016), AB Aur (Betti et al. 2022), and HD 141569 (Kueny et al. 2024). For HD 141569, Singh et al. (2021) found a mild negative slope and an absorption feature at around 1.5 µm, which might be caused by the OH bonding resonance in the reflectance across the Y–K2 bands. For complex circumstellar structures (e.g., spirals), a proper extraction of their morphology and reflectance is still challenging (e.g., Olofsson et al. 2023; Ren 2023) because most existing algorithms overfit or self-subtract, which limits a proper recovery of disk signals in high-contrast imaging observations.
To properly recover disk images to study their reflectance in an early stage of disk evolution, here we study the RX J1604.3-2130A (J1604 hereafter) disk in multiple wavelengths in scattered light with forward modeling. J1604 is a K2 ± 1 star (Preibisch & Feigelson 2005) located at a distance of 145.3 ± 0.6 pc (Gaia Collaboration 2023) with a mass of  (Fouesneau et al. 2022) and an age of 11 ± 3 Myr (Pecaut et al. 2012). Woitke et al. (2019) modeled the spectral energy distribution (SED) of J1604, showing an infrared (IR) excess of 0.18 L⊙ for λ > 6.72 µm for a stellar luminosity of L★ = 0.76 L⊙. The outer transition disk around the star is seen nearly face-on (6° inclination, Dong et al. 2017), and it is massive, with a dust mass of ~40–50 M⊕ (Barenfeld et al. 2016; Pinilla et al. 2018b). There is evidence of planet-induced dust filtration (Rice et al. 2006; Canovas et al. 2017). Köhler et al. (2000) found that a stellar companion to J1604 is located at ~2300 au. It is itself a binary with a separation of 13 au. Davies (2019) calculated the misaligned angle between the stellar rotation axis and the outer regions of this transitional disk (|i* − idisk| > 52°) at the 1.6σ level. In addition, new measurements of the projected rotational velocity (v sin i) indicated that the star is aligned with the inner disk and thus is misaligned with the outer disk (Sicilia-Aguilar et al. 2020).
The outer disk has a deep resolved gas cavity that is smaller than the dust cavity (van der Marel et al. 2015). The disk of J1604 was resolved with the Atacama Large Millimeter/submillimeter Array (ALMA; Mayama et al. 2018), in which the observations are indicative of an inner disk that is misaligned with respect to the outer disk. Considering the high-resolution continuum study of inner disks using ALMA, Francis & van der Marel (2020) measured the dust mass, which gave an upper limit of 0.013 M⊕ for the inner disk. Stadler et al. (2023) modeled 12CO intensity channel maps of the disk around J1604 and then obtained the position angle of the semimajor axis of the disk on the redshifted side (θPA = 258°.7). The authors suggested that another massive companion, presumably orbiting with a significant inclination, shapes the inner region, which spans ~0′′.25 (~35 au) based on a localized non-Keplerian feature.
In circumstellar disk systems, the misalignment between the inner and outer disk could cast shadows on the outer disk (see Bohn et al. 2022 for observation examples). Multi-epoch spec-troscopic and near-IR photometric observations reveal variability over several months, which might be linked to the instabilities or to perturbations within the inner disk (Sitko et al. 2012). In particular, changes in the shape, location, and brightness of the shadow features provide valuable insights into the structure and variability timescale of the dust casting shadow. For SAO 206462, Stolker et al. (2016) witnessed varying shadow features, which might have been caused by a local perturbation of the inner disk or by an accretion funnel flow from the inner disk onto the star. Existing high-contrast imaging observations by Pinilla et al. (2018a) found that the photometric shadows in the outer disk of J1604 are variable in morphology and in location, suggesting that the innermost regions are highly dynamic. The shadows might be evidence of a closer-in massive companion or of a complex magnetic field topology. Ruane et al. (2019) observed similar features in L′ band with Keck.
In comparison with the J-band data in Pinilla et al. (2018a), the scatter surface appears slightly farther out from the star in L′ band (Ruane et al. 2019), indicating the spatial segregation of dust particles sizes and lower opacities at longer wavelengths. Ma & Schmid (2022) conducted precise measurements of intrinsic radiation parameters, including fractional polarization and apparent disk albedo, and comprehensively characterized the scattering behavior of dust within the disk using a transition disk model. Therefore, obtaining multiband reflectance for J1604 presents an opportunity to enhance our capacity to probe the bulk composition of this disk, as well as to confirm the variability of the shadows on the outer disk to probe the inner disk. In Sect. 2, we describe the details of the J1604 observations used in this study and our data reduction procedure. Section 3 encompasses our modeling result and the reflectance derived from the observations. We explore the substructure of J1604 and discuss the limitation of the method in Sect. 4, which also features a comparative analysis of the relative reflectance between J1604 and other disks. Finally, we provide a concise summary in Sect. 5.
2 Observation and data reduction
2.1 Keck/NIRC2
We conducted an L′-band observation of J1604 using the Keck/NIRC2 vortex coronagraph, which has a pixel size of 9.942 mas (e.g., Service et al. 2016; Mawet et al. 2019) on UT 2017 May 10 (Proposal ID: C280; PI: D. Mawet). The total integration time was 3285 s (=1 s × 45 coadds × 73 frames).
During the observation, the parallactic angle rotation was 36.2. In this work, we derotated the images to align the disk and then median-combined the different exposure frames. The field rotation (i.e., parallactic angle change) therefore allows us to remove quasi-static noise. The central wavelength of the L′-band filter is 3.776 µm. The observing list consists of seven targets, including J1604 and six other stars, which we used as reference stars to remove the star light and speckles for J1604. The corresponding off-axis point spread function (PSF) was obtained by positioning the star outside the coronagraph mask with a total exposure time of 0.75 s.
We preprocessed the observation data by performing flat-fielding, correction for bad pixels, and background removal (Xuan et al. 2018). For the postprocessing, we adopted reference differential imaging (RDI): We used the Karhunen–Loève image projection algorithm (KLIP: Soummer et al. 2012) with six components to maximize the speckle removal while presenting the surface brightness and structure. The reference images were chosen from the exposure of the reference stars, selected on the basis of their cosine similarity with the preprocessed target images. To generate the six components, we used 73 reference images, which match the number of frames of the J1604 observation. To obtain the final result, we derotated all the images so that north was up and east to the left, based on their parallactic angles, before we median-combined them altogether (see Fig. 1a).
2.2 VLT/SPHERE
We retrieved archival H-band IR dual-band imager and spectrograph (IRDIS; Dohlen et al. 2008) observations of J1604 on 2015 August 13 under program (ID: 295.C-5034) and K-band IRDIS observations data on 2015 June 10 under program (ID: 095.C-0673). IRDIS is a dual-band imager (DBI; Vigan et al. 2010) in SPHERE that can produce simultaneous images at two nearby wavelengths, such as H2: 1.593 µm and H3: 1.667 µm, or K1: 2.110 µm and K2: 2.251 µm2. The pixel size of IRDIS is 12.25 mas (Maire et al. 2016). During the observation, the parallactic angle rotation in H band was 91°9 and 140.2 in K band. The exposure time in the H band and K band for each frame is 32s. Additionally, the corresponding noncoronagraphic stellar PSF was obtained with the neutral density filter ND2 and an exposure time of 0.8375s. We employed the reference library from Xie et al. (2022) to improve the performance of RDI.
We preprocessed the raw data using the vlt-sphere3 pipeline (Vigan 2020) to correct for dark, flat, and bad pixels in the coronagraphic images and in the noncoronagraphic stellar PSF image. The images were aligned using the satellite spots. Similarly to the procedure employed for the NIRC2 L′-band observations, we selected the reference images that had the highest correlation with the images of J1604, and the image numbers matched the number of frames of the target observation data. We then performed data reduction using KLIP. We derotated the images based on their parallactic angles and then median-combined all frames in each filter. The resulting images are shown in Fig. 1.
3 Analysis and results
3.1 Forward modeling
To recover the surface brightness of J1604 disk in the five filters, we adopted the forward-modeling technique (e.g., Mazoyer et al. 2020). In one band, we injected a negative disk model in the preprocessed data, then performed KLIP with reference differential imaging to minimize the residuals. The reduction parameters were identical to those Sect. 2.
We used a static and geometric disk model to analytically describe the spatial distribution of the scatterers within the disk: we adopted the three-dimensional distribution function in cylindrical coordinates from Augereau et al. (1999),
![Mathematical equation: $n(r,z) \propto {\left[ {{{\left( {{r \over {{r_{\rm{c}}}}}} \right)}^{ - 2{\alpha _{{\rm{in }}}}}} + {{\left( {{r \over {{r_{\rm{c}}}}}} \right)}^{ - 2{\alpha _{{\rm{out }}}}}}} \right]^{ - {1 \over 2}}}\exp \left[ { - {{\left( {{z \over {hr}}} \right)}^2}} \right],$](/articles/aa/full_html/2024/04/aa48874-23/aa48874-23-eq2.png) (1)
(1)
where h is the scale height, rc is the critical radius, and αin > 0 and αout < 0 are the asymptotic power-law indices when r ≪ rc and r ≫ rc. We adopted h = 0.04 from the vertical structure study of Thébault (2009), since it is not constrained for face-on systems, and we only focus on the surface brightness of the disk in this study.
Two specific angle values of the disk are needed in the modeling process: the inclination angle, and the position angle. The inclination angle (θinc) is defined as the dihedral angle between the disk midplane and the sky, and the position angle (θPA) is defined as the position angle of the disk semimajor axis measured from north to east. This semimajor axis was chosen as the axis 90° counterclockwise from the semiminor axis that was closer to Earth. For these two angles, we adopted fixed values from the analysis of ALMA observation data by Dong et al. (2017) and Stadler et al. (2023), with θinc = 6° and θPA = 258°7.
The scattering angle is defined as the angle measured from the incident light ray to the outgoing ray. The intensity of scattered light as a function of scattering angle is referred to as the scattering phase function (SPF). In this study, we adopted the parametric SPF in Henyey & Greenstein (1941) in total intensity,
 (2)
(2)
where θ is the scattering angle, and g ∈ (−1,1) is the scattering asymmetry parameter with −1 < g < 0 for backward scattering and 0 < g < 1 for forward scattering.
We combined the static geometric disk model with their corresponding SPF to obtain a model image. To align the brightness of the disk model image with the observation data, we introduced a scaling factor. We multiplied the disk model images by 10 raised to the powers of the scaling factor to compare the observations. We used the DebrisDiskFM package (Ren et al. 2019) for the disk image modeling using the Millar-Blanchaer et al. (2015) codes, which were adopted to model ring-like structures in debris disks and protoplanetary disks (e.g., Wang et al. 2020b; Quiroz et al. 2022; Ren et al. 2023b). Recognizing the potential misalignment between the image center of simulated data and observation data due to the instrument jitter or inaccuracies in the preprocessing procedures, we adopted two parameters Δx and Δy to represent the shifts of the disk along the south-north and east-west direction, respectively. Due to the low signal-to-noise ratio (S/N) of the L′-band data, we set both shifts to zero when modeling the L′-band data.
To produce an observed disk model through the finite telescope aperture, we rotated the model image generated from the DebrisDiskFM package based on the parallactic angle corresponding to each of the observation images and convolved it with the normalized PSFs obtained in Sect. 2. For the distinctive characteristics of the NIRC2 instrument, we also applied a transmission map of the NIRC2 vortex coronagraph (e.g., Wang et al. 2020b; Quiroz et al. 2022) during the L′-band modeling. We then subtracted the disk model images from the target images (i.e., negative injection) based on the corresponding parallactic angles, and we removed the stellar speckles using KLIP (see Sect. 2) to obtain the residual images. We calculated the element-wise median and standard deviation of the derotated residuals to obtain the final result for the negative injection.
The residual images have significantly lower standard deviation values in the edge region. We therefore excluded the edge region in our analysis. To obtain the best-fit models for the observed data, we maximized the log-likelihood function assuming an independent Gaussian distribution for the final negative injection result,
 (3)
(3)
where Θ is the set of the disk and offset parameters (i.e., θinc, θpA, αin, αout, rc, g, ƒflux, Δx, and Δy), Xres is the element-wise median derived from residual images across diverse exposure frameswith N pixels, and σ is the uncertainty map that has the same dimension as X. To obtain the best-fitting disk parameters for the observational data and explore the parameter space, we employed the emcee package (Foreman-Mackey et al. 2013). In order to reduce the influence of shadows of the disk (Pinilla et al. 2018a) during the modeling of the disk, we selectively excluded specific regions when calculating the likelihood function. This exclusion was achieved by applying a distinctive mask, as depicted in Fig. A.1.
Considering the similarity between the H2 and H3 band and because the S/N of the H3 band is higher than that of the H2 band, we fixed the parameters Δx (pixel) and Δy (pixel) of the H2 band to the best parameters derived from the H3 band. Similarly, in the K bands, where the S/N of K1 band is better than in the K2 band, we fixed the parameters Δx (pixel) and Δy (pixel) of the K2 band to the optimal parameters obtained from the K1 band. We present the 50 ± 34th percentiles for the retrieved disk parameters in Table 1. We present and discuss the MCMC modeling results in Appendix A.3.
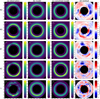 |
Fig. 1 J1604 disk images and modeling results. (a) Observation of J1604 after subtracting the stellar speckles. (b) Best-fitting model. (c) Corresponding best-fitting model convolved with the PSF and subtracted from the stellar speckle components. (d) Residual images after removing the best-fitting model and the stellar speckle components (see Sect. 3.1). The corresponding bands from the top to bottom images are H2 and H3 (2015 August 13), K1 and K2 (2015 June 10), and L (2017 May 10). The numerical labels indicate the position of the potential shadow features on the disk in Sect. 4.3.2. |
Best-fitting parameters for the J1604 disk in total intensity in scattered light.
3.2 Aperture photometry
The effective telescope aperture of Keck II is equivalent to that of a circular aperture with a diameter of 9.96 meters4. The aperture of SPHERE is 8.0 meters in diameter seen from SPHERE (Rupprecht 2005). We obtained the host star flux, denoted as Fstar (units: counts s−1), by integrating the image counts within the first-order diffraction ring divided by the exposure time. We set the aperture size to  across all bands to ensure that the ratio of the calculated flux to the true flux remains the same across different bands. After model fitting, we obtained a Markov chain of the corresponding parameters and used it to create disk model images. We obtained the average disk flux Fdisk (units: counts s−1 arcsec−2) using the median pixel count number of the model image within the same aperture divided by the angular size of a pixel and the exposure time. The center of aperture was placed near the position of the peak surface density along the disk major axis, determined by the best-fitting disk parameter rc and θPA, αin, αout using Eq. (1). We chose this region, where the scattering angle is nearly 9º, to mitigate the influence of the phase function and facilitate comparisons with studies of other systems. The resulting ratio of Fstar to Fdisk corresponds to the reflectance ρ, expressed in units of arcsec−2. This transformation effectively eliminates the influence of the stellar color and the instrument effects, enabling the quantification of the disk reflectance ρ as a function of wavelength.
Similarly, we conducted photometry on the observation data of the disk. However, it is important to note that the convolution effect of the instrument and the KLIP algorithm would influence the reflectance by introducing image blurring and reducing the surface brightness of the disk. To mitigate these effects, we divided the KLIP-reduced image by the best-fitting disk model image and subsequently mean-combined the resulting image within the region of the disk, excluding the shadows (see Fig. 1), to determine the throughput. We then corrected the reduced image by dividing it by the throughput and performed photometry on the corrected image. In this way, we can reduce the possibility that the disk model in Eq. (1) is not an accurate description of the J1604 disk morphology to calculate the reflectance. This additional photometry step also allowed us to assess the accuracy of the reflectance obtained from the disk model (see Fig. A.2). When the values of the reflectance obtained from the corrected image and the model image agreed well, we considered the results reliable.
The band widths of the H2, H3, K1, K2, and L′ bands are 0.052, 0.054, 0.102,0.109 µm (Wahhaj et al. 2022), and 0.7 µm5, respectively. Furthermore, we calculated the errors in reflectance ρ by combining the uncertainties of the stellar flux and the disk flux,
 (4)
(4)
where δFdisk for modeled disk image was calculated using the Markov chain of the model fitting. We corrected the residual image, as shown in Fig. 1, by dividing it by the throughput and performed photometry on the corrected image out of the disk region to obtain δFdisk.
To extend the wavelength coverage of our study and validate our work, we obtained total intensity models inferred from polarimetric imaging in SPHERE/IRDIS for J1604 in the J and H bands in Ma et al. (2023). Considering the polarimet-ric light as fraction of the scatter light, we added the polarized intensity model inferred from polarimetric imaging using SPHERE/ZIMPOL for J1604 in the R band, as detailed in Ma et al. (2023), which could provide a lower limit for the reflectance in total intensity. Considering the statistical findings on the polarization fraction of disks in the Ks band (2.182 µm; Ren et al. 2023a), to obtain a more accurate reflectance in the R band, we adopted a polarization fraction for J1604 of 0.4 in the R band (0.65 µm) and an upper and lower limit of 0.5 and 0.2, respectively. We note that the two bands differ significantly, which may introduce potential biases in the interpretation of the results.
We provided detailed aperture photometry results in Table 2. The final results, as shown in Figs. A.2 and 2, reveal that the disk scatters less light in the longer than in the shorter wavelengths. By analyzing the reflectance at various wavelengths, future work might constrain physical properties of the dust population, including size, shape, and composition of the micron-sized dust particles.
Detailed values for disk surface brightness measurement.
4 Discussion
4.1 Stellar brightness variation
J1604 is a young active dipper star that exhibits quasi-periodic or aperiodic dimming events in its optical and IR light curves. An analysis of the three known dippers with publicly available resolved submillimeter data, conducted by Ansdell et al. (2016), concluded that nearly edge-on viewing geometries of the outer disk could not explain the depth of the light curves. Sicilia-Aguilar et al. (2020) studied ten deep eclipses of J1604 and found that the brightness variation in H band reached 0.2– 0.7 mag. In the H2 and H3 band observations here, the stellar flux density on the second night is nearly twice that of the first night. The seeing conditions on the first night were 1''.65 ± 0''.01, while on the second night, they were 1''.29 ± 0''.05. This discrepancy indicates that the stellar flux observed on the first night was influenced by adverse weather conditions and may not be accurate. Therefore, we adopted the stellar flux obtained on the second night and conservatively used the standard deviation of the two measured flux values as the error associated with the stellar flux measurement. In other bands, we did not detect similar stellar flux variations.
The actual stellar flux variation could impact the measurements of reflectance because the photons emitted from the star arrive at the surrounding disk with a delay of several hours to a few days. For J1604, this delay is about 8 hours: The scattered-light flux variation of the disk lags the flux variation of the star. Any stellar flux variation that occurred during the observation could lead to measured fluctuations in the disk brightness that deviate from actual values and might bias the derived reflectance measurements. In the future, with the aim of enhancing the reliability of the reflectance of J1604, a more careful treatment of the difference in light arrival-time should be performed (e.g., TESS: Stark et al. 2023).
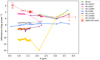 |
Fig. 2 Reflectance of different bands and different disk including HR 4796A (Debes et al. 2008; Rodigas et al. 2015; Milli et al. 2017), HD 32297 (Bhowmik et al. 2019), AB Aur (Betti et al. 2022), HD 142527 (Honda et al. 2009), HD 141569 (Singh et al. 2021; Kueny et al. 2024), HD 110058 (Stasevic et al. 2023), HD 114082, and HD 117214 (Engler et al. 2023). We scaled these disks with the square of their radial distances ratio to J1604 (see Sect. 4.2). For J1604 in the R band, we estimate the total intensity reflectance using polarization data while assuming a polarization fraction (see Sect. 3.2). Because of stellar activity and the resulting lag in photon arrival times between the star and the disk, the accuracy of the reflectance measurement is limited (see Sect. 4.1). |
4.2 Comparison with previous works
A few studies have focused on measuring the broadband reflectance or the reflectance spectrum for circumstellar disks. By situating the J1604 measurements in the reflectance of HR 4796A (Debes et al. 2008; Rodigas et al. 2015; Milli et al. 2017), HD 32297 (Bhowmik et al. 2019), AB Aur (Betti et al. 2022), HD 142527 (Honda et al. 2009), HD 141569 (Singh et al. 2021; Kueny et al. 2024), HD 110058 (Stasevic et al. 2023), HD 114082, and HD 117214 (Engler et al. 2023), we were able to study both the difference and the similarity between the environment in the debris disk, where giant planet formation has reached completion, and in the environment within the protoplanetary disk (e.g., AB Aur, J1604, HD 142527, and HD 141569), where giant planet formation is currently in progress.
Existing studies on circumstellar disks showed several features in their reflectance. Milli et al. (2017) measured the reflectance of HR 4796A from 0.5 µm to 4.0 µm, which showed a monotonically increasing trend from 0.5 µm to 1.5 µm and then was almost constant from 1.5 µm to 4 µm. Bhowmik et al. (2019) measured the reflectance spectrum of HD 32297 from 1 to 1.8 µm. The spectrum exhibited a monotonically decreasing trend with wavelength, which renders the disk color gray to blue in the YJH spectral range. Employing a color-color difference diagram (Inoue et al. 2008), Honda et al. (2009) discerned the existence of silicate and H2O ice grains of on the surface of the disk of HD 142527 with a dust size of ~1 µm. Similarly, AB Aur and HD 141569 were observed in absorption at the ice line at ~3.1 µm (Betti et al. 2022; Kueny et al. 2024). Engler et al. (2023) found that the measured reflectance spectrum of HD 117214 disk might indicate the presence of CO2 ice as a constituent of debris material at the investigated radial distance from the star and a red color at longer wavelengths than 1.66 µm for both HD 117214 and HD 114082.
The reflectance measurements of J1604 here encompass the broadest wavelength range from 0.5 µm to 4 µm to date (e.g., HR 4796A: Debes et al. 2008). Considering the decrease in the stellar light intensity with distance, which scales as 1/r2, where r is the stellocentric distance, we scaled these disk reflectances with the square of their radial distances ratio to J1604 (e.g., the scaling factor for HD 114082 is  = (31 au/61 au)2 = 0.26, and HD 32297
  = (134.7 au/61 au)2 = 4.88). The reflectance amplitudes of the debris disk after scaling, including HR 4796A, HD 117214, and HD 114082, were 10−2–10−3 arcsec−2, signifying a lower magnitude than for the reflectance amplitude of protoplanetary disks, including J1604, AB Aur, and HD 142527, which are ~10−1 arcsec−2.
We can identify a monotonically decreasing trend in the reflectance of J1604 over the wavelength range of 0.5 µm to 2.1 µm (i.e., blue color), which contrasts with the flat or gradual increase in the reflectance of HD 114082, HD 117214, HR 4796A, and HD 110058, all of which are debris disks (i.e., gray to red color). With the distance-dependent scaling, the reflectance trend of HD 32297 and HD 141569 is relatively close to that of J1604. It could be speculated that the evolution of the disk may entail a progressive transition in the shape of the reflectance spectrum, shifting from the J1604-like characteristic blue slope to those featuring a red slope resembling HR 4796A. Additionally, the reflectances of J1604 and HR 4796A both exhibit a consistent flat trend within the wavelength range of 2.1 µm to 4 µm. In contrast, for AB Aur, HD 141569, and HD 141527, the reflectance at ~3.8 µm is larger than that at ~2.2 µm in the same wavelength span and showed potential water-ice absorption. We note the necessity for additional data points of J1604 within the wavelength range of 2.1 µm to 4 µm to explore its corresponding features. Finally, potential biases in compiling and analyzing the statistical results should not be disregarded, since there are inconsistencies in the existing surface brightness measuring and in the reporting methods in previous work. Specifically, the reflectance measurement by Singh et al. (2021), along with some other studies, used the average flux of the whole disk, which is different from our measurement in Sect. 3.2. The limited quantity of available samples hinders a comprehensive analysis. Future studies of reflectance spectra using an integral field spectrograph (IFS), including SPHERE and the Gemini planet Imager (GPI), will help us to better probe the spectroscopic trends as well as the mineralogical composition of circumstellar disks when aided with laboratory measurements (e.g., Poch et al. 2023).
4.3 Varying disk structure
4.3.1 Structure
The disk geometry structure that we obtained by forward-modeling varies with the wavelengths. Although the fitting parameters rc, αin, and αout in the H band closely resemble those in the K band due to the proximity in wavelength, significant differences are observed in the best-fitting parameters rc, αin, and αout for the L′ band. The significant difference in wavelength may be attributed to the spatial segregation of dust particles, which vary in size and scattering properties, potentially influenced by size-dependent forces. For example, the unitless ratio β of the radiation pressure and gravitational forces exhibits an inverse proportionality to the grain size for grains larger than a few µm (Olofsson et al. 2022). Additionally, the drag that the gas exerts on the grains is known to be size dependent (Takeuchi & Artymowicz 2001).
In comparison to the L′ band, the values of αin in the H and K bands are notably higher, indicating a sharper inner edge. This result suggests the possible presence of dust particles that condensed at the inner edge, such as NH3, water ice, and hydrated minerals (Popa & Udrea 2019)6, which exhibit strong light-absorption characteristics in the H or K bands, but exhibit a weaker effect in the L′ band. Another explanation for the observed cavity with a sharp edge in both the K and H band could involve the presence of a ~15 MJup brown dwarf orbiting at ~15 au (Canovas et al. 2017). It is well established that a massive giant planet can create a cavity with a sharp edge within the disk (Pinilla et al. 2012; Johansen et al. 2019). Rodigas et al. (2014) derived a linear expression relating the maximum mass of a shepherding planet to the observed width in scattered light of the debris ring. However, J1604 is not a debris system, but a protoplanetary/transition disk that is rich in gas, and it can therefore involve more complex mechanisms. Future work on the radial distribution of rings in protoplanetary/transition disks could better explain the observation in this study.
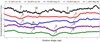 |
Fig. 3 Azimuthal profiles of depro-jected J1604 observation data from the KLIP results with r2 illumination correction. Component ‘A’ vanished between 2015 Jun. and Aug., while ‘B’ and ‘C’ enhanced then. One additional component ‘D’ might start appearing in 2017 May. The vertical arrangement, from bottom to top, aligns with the chronological sequence the observation period. |
4.3.2 Shadows
The observed asymmetry of the transition disks in the form of shadows is widely attributed to the inner disk, which is significantly inclined relative to the outer disk, resulting in the casting of varying-depth shadows onto the outer disk (Bohn et al. 2022). Min et al. (2017) provided analytical equations describing the positions of these shadow features as a function of the orientation between the inner and outer disk and the height of the outer disk wall, such as HD 100453. Based on the hydrodynamic simulations combined with three-dimensional radiative transfer calculations, Benisty et al. (2018) adopted a warped-disk model and reproduced all main morphological features for HD 143006. Similarly, Muro-Arena et al. (2020) found that a single misaligned ring was insufficient to account for the wide shadow and instead used two separate misaligned zones to effectively reproduce most of the observed features within the protoplane-tary disk of HD 139614. Through a comparative analysis of STIS images in 2000 and those from NICMOS in 1998, 2004, and 2005, Debes et al. (2017) quantified a constant angular velocity in the azimuthal brightness asymmetry of the TW Hya disk, manifesting a counterclockwise direction. Recently, Debes et al. (2023) reported two distinct shadows observed in TW Hya that changed from the one shadwo in Debes et al. (2017).
We detected potential physical substructures exhibiting a pixel-wise average S/N exceeding 1, including two shadows, and one potential inner dust. After subtracting the best-fitting model and the stellar PSF components, we present the residual images in Fig. 1. Specifically, we observed one round shadow and two indistinct shadows in the K bands on 2015 June 10, denoted A, B?, and C? in Fig. 1. From the observation in the H bands on 2015 August 13, we identified one narrow shadow accompanied by another wider shadow, denoted B and C in Fig. 1, both of which closely neighbored two indistinct shadows in the K bands. Additionally, the L'-band observations on 2017 May 10 revealed the presence of two wide shadow and an additional inconspicuous shadow, denoted B, C, and D? in Fig. 1. To quantify the asymmetry, we computed radially averaged azimuthal profiles of the reduced disk data using apertures with a radius of 6 pixels placed near the position of rc, after deprojecting the image using θinc = 6° and θPA = 258°.7 and scaling by its distance from the central star. The resulting figure is Fig. 3
The temporal variability of the shadows agrees with the findings of Pinilla et al. (2018a). In comparison to the shadow observations reported by Muro-Arena et al. (2020) and Debes et al. (2023), the shadows observed in this study have several similar dynamics features. Similarly, the number of the shadows varies with time. Furthermore, considering the observed data for J1604, we could infer the existence of potential multiply misaligned and dynamic rings within the inner region, which may contribute to the generation of wide and variable shadows. This inference suggests that the brighter inner side could coincide with the fainter region of the outer disk. However, unlike the two overlapping shadows reported by Debes et al. (2023), our H-band observations revealed nonoverlapping shadows. In contrast to the multiple arc feature out of the parallactic angle range of the shadow reported by Muro-Arena et al. (2020), we detected only one possible arc in the H3-band observation. Taking in account the observation by Pinilla et al. (2018a), we inferred that the shadow of J1604 occupied the A position between 2012 and 2015. We confirmed the change in the number of shadows from one to two in 2015. It is likely that the A shadow disappeared in 2015, and then the shadows in positions B and C gradually became evident, which was distinct from the rotation of the shadows and cannot be explained by the precession of an inner disk (Debes et al. 2017). The observations reported here show a distinct and previously less explored dynamical characteristics of the inner disks.
Due to the low dust mass and high inclination, small separation, the inner disk remains inaccessible for direct-imaging instruments. We detected positive residuals interior to one shadow (‘C’) in the outer disk. If the signal is confirmed, it might be residual dust right outside the coronagraph that is better revealed after disk modeling. The dust can block more light and cause the shadow on the outer disk to be darker and wider than another shadow (B). While this may be a spiral running away from the inner disk due to a massive coronal mass ejection (CME) along the equatorial plane of the star (e.g., Olofsson et al. 2018), it should be noted that a CME is for M stars and not applicable for J1604, which is a K2 star.
The residual images of other bands also reveal discernible shadows at varying positions (see Fig. 1). Due to the low S/N, we do not discuss the residual images in other bands further (i.e., K and L′).
5 Conclusion
We conducted L′-band observations of the J1604 protoplane-tary disk system using the Keck/NIRC2 vortex coronagraph on UT 2017 May 10. We also retrieved archival SPHERE observations of J1604 on 2015 August 13 in H2 and H3 band and on 2015 June 10 in K1 and K2 band. Using KLIP postprocessing with reference differential imaging (either exposures in nearby nights for NIRC2, or archival exposures for IRDIS), we obtained the images of the J1604 disk. We forward-modeled the disk in different bands to obtain its original surface brightness.
Using forward-modeling and comparing our results with stellar photometry (within 1.22λ/D), we obtained the broadband relative reflectance for J1604 in total-intensity imaging observations. Together with the shorter-wavelength SPHERE study in polarized light and for the R and H band (Ma et al. 2023), our J1604 reflectance measurements span a broad wavelength range from 0.5 µm to 4 µm. On the one hand, from 0.5 µm to 2.1 µm, we observe a monotonically decreasing trend in its reflectance. This trend contrasts with previous work that showed a gradually increasing trend for debris disks (e.g., HD 114082, HD 117214, and HR 4796A), illustrating a potential mineralogical difference in different evolutionary stages of circumstellar disks. The evolution of the disk might thus have a progressive transition in the shape of the reflectance spectrum, shifting from the J1604-like characteristic blue slope to those featuring a red slope resembling HR 4796A. On the other hand, from 2.1 µm to 4 µm, we observe a relatively flat reflectance. This differs from the phenomenon that the reflectance at ~3.8 µm is larger than that at ~2.2 µm observed in the reflectance of AB Aur, HD 142527, and HD 141569, suggesting a difference in the dust mineralogy that might be due to a different protoplanetary disk stage or even have different molecular cloud origins. Moving forward, to further explore the trends and differences in the reflectance of circumstellar disks, future studies of reflectance spectra with integral field spectroghaphs (e.g., SPHERE, Gemini planet Imager) that can spatially resolve circumstellar systems are necessary.
The shadow variation that cannot be explained by the precession of the inner disk shows that we are in the era of witnessing a possible distinct and previously less explored dynamical characteristics of inner disks in protoplanetary systems (e.g., Debes et al. 2023). We identified a shadow that vanished in 2015 (labeled A) and two shadows that were potentially enhanced (labeled B and C). Our modeling residuals show potential dust components that can cast shadows on the outer disk. Future multi-epoch follow-up of outer disks in scattered light could help us probe the dynamics of the inner disks and study the connection of the two regions (e.g., Bohn et al. 2022).
Acknowledgements
We thank Myriam Benisty for discussions on shadowing effects, and Juan Quiroz for sharing a disk modeling example. We thank Benoît Carry, Pierre Beck, and Oliver Poch for discusssions on dust reflectance. This research has received funding from the European Union’s Horizon Europe research and innovation programme under the Marie Skłodowska-Curie grant agreement No. 101103114. This project has received funding from the European Research Council (ERC) under the European Union’s Horizon 2020 research and innovation programme (PROTOPLANETS, grant agreement No. 101002188). We acknowledge the financial support from the National Key R&D Program of China (2020YFC2201400), NSFC grant 12073092, 12103097, 12103098, 11733006, the science research grants from the China Manned Space Project (No. CMS-CSST-2021-B09), Guangdong Major Project of Basic and Applied Basic Research (grant No. 2019B030302001), Guangzhou Basic and Applied Basic Research Program (202102080371), and the Fundamental Research Funds for the Central Universities, Sun Yat-sen University. Based on observations performed with VLT/SPHERE under program ID 095.C-0673(A) and 295.C-5034(A). This research is partially supported by NASA ROSES XRP, award 80NSSC19K0294. Some of the data presented herein were obtained at the W.M. Keck Observatory, which is operated as a scientific partnership among the California Institute of Technology, the University of California and the National Aeronautics and Space Administration. The Observatory was made possible by the generous financial support of the W.M. Keck Foundation. The authors wish to recognize and acknowledge the very significant cultural role and reverence that the summit of Maunakea has always had within the indigenous Hawaiian community. We are most fortunate to have the opportunity to conduct observations from this mountain. Part of the computations presented here were conducted in the Resnick High Performance Computing Center, a facility supported by Resnick Sustainability Institute at the California Institute of Technology.
Appendix A Auxiliary images
A.1 The mask
 |
Fig. A.1 Masks used in forward-modeling. The black region was masked when the likelihood function in Eq. (1) was calculated. The blue circle masked the region whithin which we calculated the average disk surface brightness for disk in the major axis, and the yellow circle masked the region whithin which we calculated the average disk surface brightness for the disk out of the major axis to avoid the affect of the shadow. |
In order to reduce the influence of shadows on the disk modeling (e.g., Pinilla et al. 2018a), we selectively excluded specific regions when calculating the likelihood function and calculating the throughput factors. This exclusion was achieved by applying the boolean masks in Fig. A.1. Similarly, we extracted the disk reflectance in different regions to validate the measurements.
A.2 Validation of the reflectance measurements
We measured the reflectance using the J1604 observation with a throughput correction in two distinct regions: The first region corresponds to the major axis, where the scatting angle is nearly 9ºo,and the second region pertains to an off-axis area to reduce the influence of shadows. We validated the consistency of the results in Fig. A.2 from different methods and Ma et al. (2023).
A.3 Markov chain Monte Carlo modeling of corner plots
We present the MCMC posteriors for the H3 band in Fig. A.3. We observed several strong correlations among several parameters (e.g., g and brightness scaling factor, αin, Rc, αout, and Rc). These correlations are anticipated and can be explained given the SPF and disk geometry setup in Sect. 3.1. On the one hand, the Henyey-Greenstein parameter g depicts the redistribution of light as a function of scattering angle (i.e., SPF), which distributes more light to smaller scattering angles as a positive g increases in Eq. (2). It thus requires higher brightness scaling factors for larger g to reproduce the nearly face-on disk for J1604. On the other hand, αin and αour describe the asymptotic radial power-law indices interior and exterior to Rc. To reproduce any disk surface brightness distribution, an increase in Rc requires a decrease in the positive αin (or a decrease in the negative αour) to produce the surface brightness interior to (or exterior to) it in Eq. (1), since otherwise, the interior regions would be too faint (or the exterior regions would be too bright).
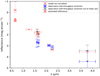 |
Fig. A.2 Reflectance of different bands and different methods of J1604. Notably, the black and blue points overlap in the K1 band. We present the relative reflectance values expressed in units of mag arcsec−2, where the magnitude is calculated as −2.5 log10 ƒref with ƒref representing reflectance ratio. Notably, we obtained the polarized disk intensity instead of the total intensity in the R band. For J1604 in the R band, we estimate the total intensity reflectance using polarization data while assuming a polarization fraction (see Sect. 3.2). |
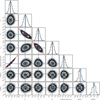 |
Fig. A.3 MCMC posteriors from forward-modeling of J1604 in the H3 band. Dashed vertical lines show 50th percentiles, and the maximum likelihood parameters are denoted using blue lines. |
References
- Adibekyan, V., Dorn, C., Sousa, S. G., et al. 2021, Science, 374, 330 [NASA ADS] [CrossRef] [Google Scholar]
- Ansdell, M., Gaidos, E., Williams, J. P., et al. 2016, MNRAS, 462, L101 [Google Scholar]
- Augereau, J. C., Lagrange, A. M., Mouillet, D., Papaloizou, J. C. B., & Grorod, P. A. 1999, A&A, 348, 557 [NASA ADS] [Google Scholar]
- Barenfeld, S. A., Carpenter, J. M., Ricci, L., & Isella, A. 2016, ApJ, 827, 142 [Google Scholar]
- Benisty, M., Juhász, A., Facchini, S., et al. 2018, A&A, 619, A171 [NASA ADS] [CrossRef] [EDP Sciences] [Google Scholar]
- Betti, S. K., Follette, K., Jorquera, S., et al. 2022, AJ, 163, 145 [NASA ADS] [CrossRef] [Google Scholar]
- Beuzit, J. L., Vigan, A., Mouillet, D., et al. 2019, A&A, 631, A155 [NASA ADS] [CrossRef] [EDP Sciences] [Google Scholar]
- Bhowmik, T., Boccaletti, A., Thebault, P., et al. 2019, A&A, 630, A85 [NASA ADS] [CrossRef] [EDP Sciences] [Google Scholar]
- Bohn, A. J., Benisty, M., Perraut, K., et al. 2022, A&A, 658, A183 [NASA ADS] [CrossRef] [EDP Sciences] [Google Scholar]
- Canovas, H., Hardy, A., Zurlo, A., et al. 2017, A&A, 598, A43 [NASA ADS] [CrossRef] [EDP Sciences] [Google Scholar]
- Davies, C. L. 2019, MNRAS, 484, 1926 [NASA ADS] [CrossRef] [Google Scholar]
- Debes, J. H., Weinberger, A. J., & Schneider, G. 2008, ApJ, 673, L191 [NASA ADS] [CrossRef] [Google Scholar]
- Debes, J. H., Poteet, C. A., Jang-Condell, H., et al. 2017, ApJ, 835, 205 [NASA ADS] [CrossRef] [Google Scholar]
- Debes, J., Nealon, R., Alexander, R., et al. 2023, ApJ, 948, 36 [NASA ADS] [CrossRef] [Google Scholar]
- Dohlen, K., Langlois, M., Saisse, M., et al. 2008, SPIE Conf. Ser., 7014, 70143L [Google Scholar]
- Dong, R., van der Marel, N., Hashimoto, J., et al. 2017, ApJ, 836, 201 [NASA ADS] [CrossRef] [Google Scholar]
- Dressing, C. D., Charbonneau, D., Dumusque, X., et al. 2015, ApJ, 800, 135 [NASA ADS] [CrossRef] [Google Scholar]
- Engler, N., Milli, J., Gratton, R., et al. 2023, A&A, 672, A1 [NASA ADS] [CrossRef] [EDP Sciences] [Google Scholar]
- Foreman-Mackey, D., Hogg, D. W., Lang, D., & Goodman, J. 2013, PASP, 125, 306 [Google Scholar]
- Fouesneau, M., Andrae, R., Dharmawardena, T., et al. 2022, A&A, 662, A125 [NASA ADS] [CrossRef] [EDP Sciences] [Google Scholar]
- Francis, L., & van der Marel, N. 2020, ApJ, 892, 111 [Google Scholar]
- Gaia Collaboration (Vallenari, A., et al.) 2023, A&A, 674, A1 [NASA ADS] [CrossRef] [EDP Sciences] [Google Scholar]
- Henyey, L. G., & Greenstein, J. L. 1941, ApJ, 93, 70 [Google Scholar]
- Honda, M., Inoue, A. K., Fukagawa, M., et al. 2009, ApJ, 690, L110 [Google Scholar]
- Honda, M., Kudo, T., Takatsuki, S., et al. 2016, ApJ, 821, 2 [NASA ADS] [CrossRef] [Google Scholar]
- Inoue, A. K., Honda, M., Nakamoto, T., & Oka, A. 2008, PASJ, 60, 557 [NASA ADS] [Google Scholar]
- Jiang, H., & Ormel, C. W. 2023, MNRAS, 518, 3877 [Google Scholar]
- Johansen, A., Ida, S., & Brasser, R. 2019, A&A, 622, A202 [NASA ADS] [CrossRef] [EDP Sciences] [Google Scholar]
- Köhler, R., Kunkel, M., Leinert, C., & Zinnecker, H. 2000, A&A, 356, 541 [NASA ADS] [Google Scholar]
- Kueny, J. K., Weinberger, A. J., Males, J. R., et al. 2024, ApJ, 961, 77 [CrossRef] [Google Scholar]
- Ma, J., & Schmid, H. M. 2022, A&A, 663, A110 [NASA ADS] [CrossRef] [EDP Sciences] [Google Scholar]
- Ma, J., Schmid, H. M., & Tschudi, C. 2023, A&A, 676, A6 [NASA ADS] [CrossRef] [EDP Sciences] [Google Scholar]
- Mah, J., Bitsch, B., Pascucci, I., & Henning, T. 2023, A&A, 677, L7 [CrossRef] [EDP Sciences] [Google Scholar]
- Maire, A.-L., Langlois, M., Dohlen, K., et al. 2016, SPIE Conf. Ser., 9908, 990834 [Google Scholar]
- Mawet, D., Hirsch, L., Lee, E. J., et al. 2019, AJ, 157, 33 [NASA ADS] [CrossRef] [Google Scholar]
- Mayama, S., Akiyama, E., Panic, O., et al. 2018, ApJ, 868, L3 [NASA ADS] [CrossRef] [Google Scholar]
- Mazoyer, J., Arriaga, P., Hom, J., et al. 2020, SPIE Conf. Ser., 11447, 1144759 [NASA ADS] [Google Scholar]
- Millar-Blanchaer, M. A., Graham, J. R., Pueyo, L., et al. 2015, ApJ, 811, 18 [Google Scholar]
- Miller, N., & Fortney, J. J. 2011, ApJ, 736, L29 [NASA ADS] [CrossRef] [Google Scholar]
- Milli, J., Vigan, A., Mouillet, D., et al. 2017, A&A, 599, A108 [NASA ADS] [CrossRef] [EDP Sciences] [Google Scholar]
- Min, M., Stolker, T., Dominik, C., & Benisty, M. 2017, A&A, 604, A10 [Google Scholar]
- Morbidelli, A., Bitsch, B., Crida, A., et al. 2016, Icarus, 267, 368 [Google Scholar]
- Müller, S., & Helled, R. 2023, Front. Astron. Space Sci., 10, 1179000 [CrossRef] [Google Scholar]
- Müller, S., Ben-Yami, M., & Helled, R. 2020, ApJ, 903, 147 [Google Scholar]
- Muro-Arena, G. A., Benisty, M., Ginski, C., et al. 2020, A&A, 635, A121 [NASA ADS] [CrossRef] [EDP Sciences] [Google Scholar]
- Olofsson, J., van Holstein, R. G., Boccaletti, A., et al. 2018, A&A, 617, A109 [NASA ADS] [CrossRef] [EDP Sciences] [Google Scholar]
- Olofsson, J., Thébault, P., Kennedy, G. M., & Bayo, A. 2022, A&A, 664, A122 [NASA ADS] [CrossRef] [EDP Sciences] [Google Scholar]
- Olofsson, J., Thébault, P., Bayo, A., et al. 2023, A&A, 674, A84 [NASA ADS] [CrossRef] [EDP Sciences] [Google Scholar]
- Pacetti, E., Turrini, D., Schisano, E., et al. 2022, ApJ, 937, 36 [NASA ADS] [CrossRef] [Google Scholar]
- Pecaut, M. J., Mamajek, E. E., & Bubar, E. J. 2012, ApJ, 746, 154 [Google Scholar]
- Pinilla, P., Benisty, M., & Birnstiel, T. 2012, A&A, 545, A81 [NASA ADS] [CrossRef] [EDP Sciences] [Google Scholar]
- Pinilla, P., Benisty, M., de Boer, J., et al. 2018a, ApJ, 868, 85 [NASA ADS] [CrossRef] [Google Scholar]
- Pinilla, P., Tazzari, M., Pascucci, I., et al. 2018b, ApJ, 859, 32 [Google Scholar]
- Piso, A.-M. A., & Youdin, A. N. 2014, ApJ, 786, 21 [NASA ADS] [CrossRef] [Google Scholar]
- Piso, A.-M. A., Youdin, A. N., & Murray-Clay, R. A. 2015, ApJ, 800, 82 [Google Scholar]
- Plotnykov, M., & Valencia, D. 2020, MNRAS, 499, 932 [CrossRef] [Google Scholar]
- Poch, O., Istiqomah, I., Quirico, E., et al. 2023, European Conference on Laboratory Astrophysics ECLA2020, The Interplay of Dust, 59, 271 [CrossRef] [Google Scholar]
- Pollack, J. B., Hubickyj, O., Bodenheimer, P., et al. 1996, Icarus, 124, 62 [NASA ADS] [CrossRef] [Google Scholar]
- Popa, D., & Udrea, F. 2019, Sensors, 19 [Google Scholar]
- Preibisch, T., & Feigelson, E. D. 2005, ApJS, 160, 390 [NASA ADS] [CrossRef] [Google Scholar]
- Quiroz, J., Wallack, N. L., Ren, B., et al. 2022, ApJ, 924, L4 [NASA ADS] [CrossRef] [Google Scholar]
- Ren, B. B. 2023, A&A, 679, A18 [NASA ADS] [CrossRef] [EDP Sciences] [Google Scholar]
- Ren, B., Choquet, É., Perrin, M. D., et al. 2019, ApJ, 882, 64 [Google Scholar]
- Ren, B. B., Benisty, M., Ginski, C., et al. 2023a, A&A, 680, A114 [NASA ADS] [CrossRef] [EDP Sciences] [Google Scholar]
- Ren, B. B., Rebollido, I., Choquet, É., et al. 2023b, A&A, 672, A114 [NASA ADS] [CrossRef] [EDP Sciences] [Google Scholar]
- Rice, W. K. M., Armitage, P. J., Wood, K., & Lodato, G. 2006, MNRAS, 373, 1619 [Google Scholar]
- Rodigas, T. J., Malhotra, R., & Hinz, P. M. 2014, ApJ, 780, 65 [Google Scholar]
- Rodigas, T. J., Stark, C. C., Weinberger, A., et al. 2015, ApJ, 798, 96 [Google Scholar]
- Rogers, L. A., & Seager, S. 2010, ApJ, 716, 1208 [NASA ADS] [CrossRef] [Google Scholar]
- Ruane, G., Ngo, H., Mawet, D., et al. 2019, AJ, 157, 118 [NASA ADS] [CrossRef] [Google Scholar]
- Rupprecht, G. 2005, Requirements for Scientific Instruments on the VLT Unit Telescopes, Tech. rep., VLT-SPE-ESO-10000-2723 publicly available at https://www.eso.org/sci/facilities/develop/documents/VLT-SPE-ESO-10000-2723_is1.pdf [Google Scholar]
- Service, M., Lu, J. R., Campbell, R., et al. 2016, PASP, 128, 095004 [NASA ADS] [CrossRef] [Google Scholar]
- Sicilia-Aguilar, A., Manara, C. F., de Boer, J., et al. 2020, A&A, 633, A37 [NASA ADS] [CrossRef] [EDP Sciences] [Google Scholar]
- Singh, G., Bhowmik, T., Boccaletti, A., et al. 2021, A&A, 653, A79 [NASA ADS] [CrossRef] [EDP Sciences] [Google Scholar]
- Sitko, M. L., Day, A. N., Kimes, R. L., et al. 2012, ApJ, 745, 29 [NASA ADS] [CrossRef] [Google Scholar]
- Soummer, R., Pueyo, L., & Larkin, J. 2012, ApJ, 755, L28 [Google Scholar]
- Spiegel, D. S., & Burrows, A. 2012, ApJ, 745, 174 [Google Scholar]
- Stadler, J., Benisty, M., Izquierdo, A., et al. 2023, A&A, 670, L1 [NASA ADS] [CrossRef] [EDP Sciences] [Google Scholar]
- Stark, C. C., Ren, B., MacGregor, M. A., et al. 2023, ApJ, 945, 131 [NASA ADS] [CrossRef] [Google Scholar]
- Stasevic, S., Milli, J., Mazoyer, J., et al. 2023, A&A, 678, A8 [NASA ADS] [CrossRef] [EDP Sciences] [Google Scholar]
- Stolker, T., Dominik, C., Avenhaus, H., et al. 2016, A&A, 595, A113 [NASA ADS] [CrossRef] [EDP Sciences] [Google Scholar]
- Takeuchi, T., & Artymowicz, P. 2001, ApJ, 557, 990 [NASA ADS] [CrossRef] [Google Scholar]
- Thébault, P. 2009, A&A, 505, 1269 [Google Scholar]
- Thorngren, D. P., Fortney, J. J., Murray-Clay, R. A., & Lopez, E. D. 2016, ApJ, 831, 64 [NASA ADS] [CrossRef] [Google Scholar]
- Turrini, D., Schisano, E., Fonte, S., et al. 2021, ApJ, 909, 40 [Google Scholar]
- van der Marel, N., van Dishoeck, E. F., Bruderer, S., Perez, L., & Isella, A. 2015, A&A, 579, A106 [NASA ADS] [CrossRef] [EDP Sciences] [Google Scholar]
- Vigan, A. 2020, Astrophysics Source Code Library [record ascl:2009.002] [Google Scholar]
- Vigan, A., Moutou, C., Langlois, M., et al. 2010, MNRAS, 407, 71 [Google Scholar]
- Wahhaj, Z., Jones, M., de Rosa, R., et al. 2022, Very Large Telescope SPHERE User Manual, Tech. rep., VLT-MAN-SPH-14690-0430 publicaly available at https://www.eso.org/sci/facilities/paranal/instruments/sphere/doc/VLT-MAN-SPH-14690-0430_P111_dec_2022_zwa.pdf [Google Scholar]
- Wang, J., Wang, J. J., Ma, B., et al. 2020a, AJ, 160, 150 [NASA ADS] [CrossRef] [Google Scholar]
- Wang, J. J., Ginzburg, S., Ren, B., et al. 2020b, AJ, 159, 263 [Google Scholar]
- Weiss, L. M., & Marcy, G. W. 2014, ApJ, 783, L6 [Google Scholar]
- Woitke, P., Kamp, I., Antonellini, S., et al. 2019, PASP, 131, 064301 [NASA ADS] [CrossRef] [Google Scholar]
- Xie, C., Choquet, E., Vigan, A., et al. 2022, A&A, 666, A32 [NASA ADS] [CrossRef] [EDP Sciences] [Google Scholar]
- Xuan, W. J., Mawet, D., Ngo, H., et al. 2018, AJ, 156, 156 [NASA ADS] [CrossRef] [Google Scholar]
- Zeng, L., Jacobsen, S. B., Sasselov, D. D., et al. 2019, PNAS, 116, 9723 [Google Scholar]
https://github.com/avigan/SPHERE, version 1.4.2.
All Tables
Best-fitting parameters for the J1604 disk in total intensity in scattered light.
All Figures
|
Fig. 1 J1604 disk images and modeling results. (a) Observation of J1604 after subtracting the stellar speckles. (b) Best-fitting model. (c) Corresponding best-fitting model convolved with the PSF and subtracted from the stellar speckle components. (d) Residual images after removing the best-fitting model and the stellar speckle components (see Sect. 3.1). The corresponding bands from the top to bottom images are H2 and H3 (2015 August 13), K1 and K2 (2015 June 10), and L (2017 May 10). The numerical labels indicate the position of the potential shadow features on the disk in Sect. 4.3.2. |
| In the text | |
|
Fig. 2 Reflectance of different bands and different disk including HR 4796A (Debes et al. 2008; Rodigas et al. 2015; Milli et al. 2017), HD 32297 (Bhowmik et al. 2019), AB Aur (Betti et al. 2022), HD 142527 (Honda et al. 2009), HD 141569 (Singh et al. 2021; Kueny et al. 2024), HD 110058 (Stasevic et al. 2023), HD 114082, and HD 117214 (Engler et al. 2023). We scaled these disks with the square of their radial distances ratio to J1604 (see Sect. 4.2). For J1604 in the R band, we estimate the total intensity reflectance using polarization data while assuming a polarization fraction (see Sect. 3.2). Because of stellar activity and the resulting lag in photon arrival times between the star and the disk, the accuracy of the reflectance measurement is limited (see Sect. 4.1). |
| In the text | |
|
Fig. 3 Azimuthal profiles of depro-jected J1604 observation data from the KLIP results with r2 illumination correction. Component ‘A’ vanished between 2015 Jun. and Aug., while ‘B’ and ‘C’ enhanced then. One additional component ‘D’ might start appearing in 2017 May. The vertical arrangement, from bottom to top, aligns with the chronological sequence the observation period. |
| In the text | |
|
Fig. A.1 Masks used in forward-modeling. The black region was masked when the likelihood function in Eq. (1) was calculated. The blue circle masked the region whithin which we calculated the average disk surface brightness for disk in the major axis, and the yellow circle masked the region whithin which we calculated the average disk surface brightness for the disk out of the major axis to avoid the affect of the shadow. |
| In the text | |
|
Fig. A.2 Reflectance of different bands and different methods of J1604. Notably, the black and blue points overlap in the K1 band. We present the relative reflectance values expressed in units of mag arcsec−2, where the magnitude is calculated as −2.5 log10 ƒref with ƒref representing reflectance ratio. Notably, we obtained the polarized disk intensity instead of the total intensity in the R band. For J1604 in the R band, we estimate the total intensity reflectance using polarization data while assuming a polarization fraction (see Sect. 3.2). |
| In the text | |
|
Fig. A.3 MCMC posteriors from forward-modeling of J1604 in the H3 band. Dashed vertical lines show 50th percentiles, and the maximum likelihood parameters are denoted using blue lines. |
| In the text | |
Current usage metrics show cumulative count of Article Views (full-text article views including HTML views, PDF and ePub downloads, according to the available data) and Abstracts Views on Vision4Press platform.
Data correspond to usage on the plateform after 2015. The current usage metrics is available 48-96 hours after online publication and is updated daily on week days.
Initial download of the metrics may take a while.