Fig. 1

Download original image
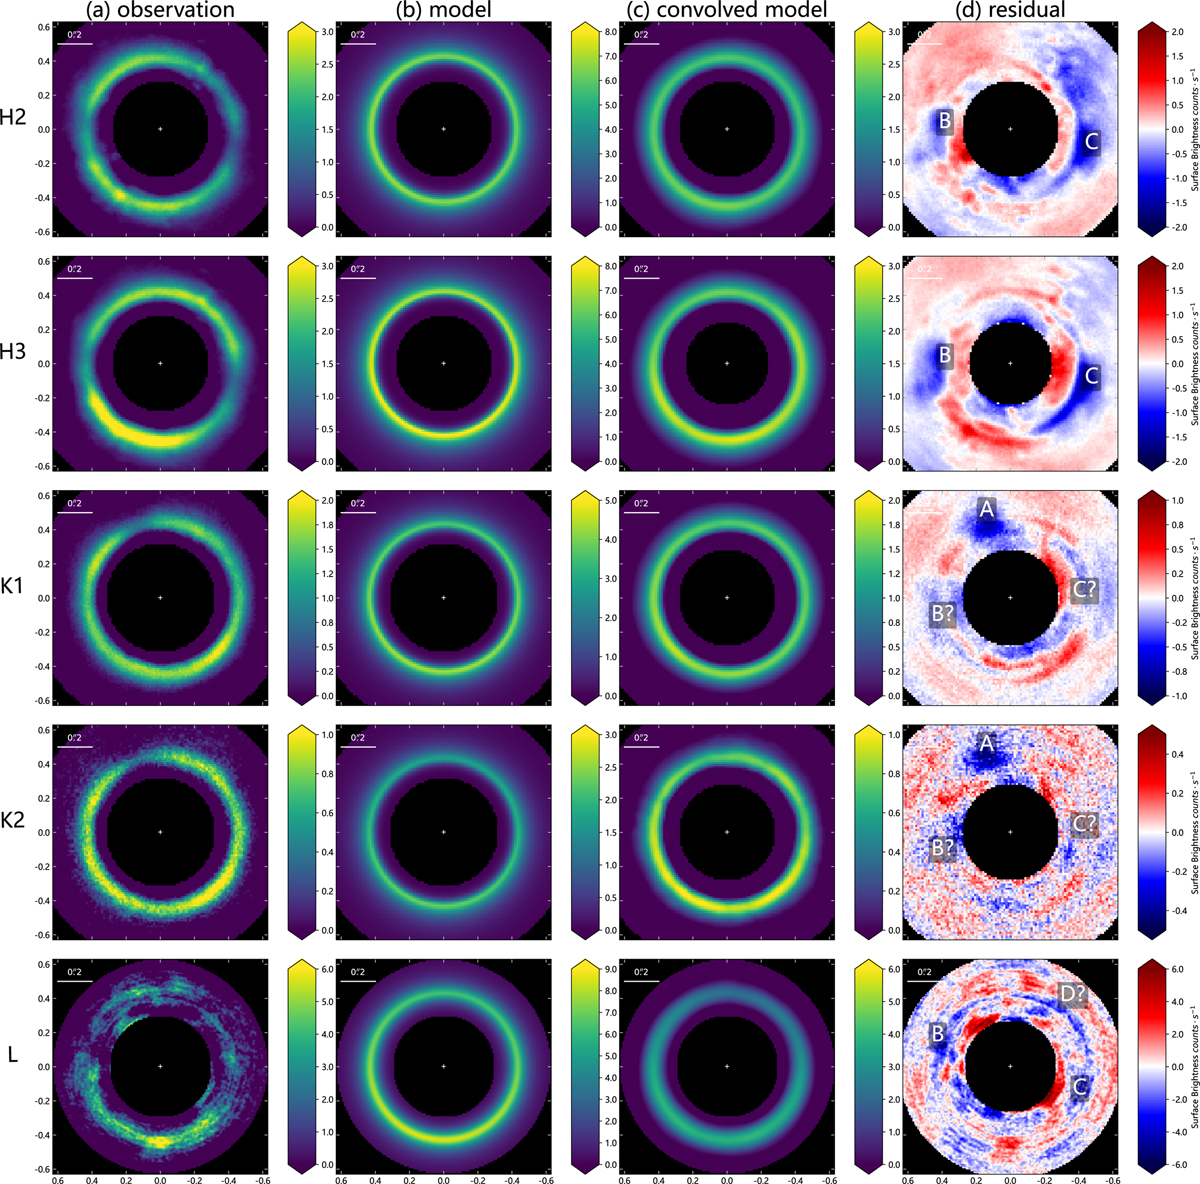
J1604 disk images and modeling results. (a) Observation of J1604 after subtracting the stellar speckles. (b) Best-fitting model. (c) Corresponding best-fitting model convolved with the PSF and subtracted from the stellar speckle components. (d) Residual images after removing the best-fitting model and the stellar speckle components (see Sect. 3.1). The corresponding bands from the top to bottom images are H2 and H3 (2015 August 13), K1 and K2 (2015 June 10), and L (2017 May 10). The numerical labels indicate the position of the potential shadow features on the disk in Sect. 4.3.2.
Current usage metrics show cumulative count of Article Views (full-text article views including HTML views, PDF and ePub downloads, according to the available data) and Abstracts Views on Vision4Press platform.
Data correspond to usage on the plateform after 2015. The current usage metrics is available 48-96 hours after online publication and is updated daily on week days.
Initial download of the metrics may take a while.


